FireShield Risk
Wildfire risk, calculated the way earthquake risk is
Not a color on a county map. A probability, for one property, built from where fires start, how often they get large, and what the ground between you and them will actually carry.
The method
Borrowed from a field that solved this problem fifty years ago
Structural engineers stopped asking “is this an earthquake area?” a long time ago. They ask a sharper question: for this building, what is the chance of exceeding a given level of shaking in a given period? That question is answered by probabilistic seismic hazard analysis, and every building code in California rests on it.
Wildfire is usually still discussed the first way — a zone, a tier, a color on a map. Our founder spent his career on the second kind of question, and FireShield’s hazard model is built with the same three pieces.
| The piece | Earthquake | Wildfire |
|---|---|---|
| Where it can start | Faults, and how often each one ruptures. | Ignition sources and their spatial density — lightning, powerlines, roadsides, equipment. Some ground simply starts more fires than other ground. |
| How big, how often | A recurrence relationship: many small earthquakes, few large ones. | The same shape, and more extreme. A small minority of fires account for most of the burned area, so a model built on the average fire describes a season that never happens. |
| What reaches you | A ground-motion prediction equation: rupture to shaking at your address, through distance and soil. | A landscape relationship: ignition to fire intensity at your address, through fuel, terrain and weather. This is the term that does the work, and the one with no textbook answer. |
The one that matters most. In earthquake work, the ground-motion prediction equation carries a rupture across distance and soil to arrive as shaking at your address. Wildfire needs the same bridge, and it is harder: the medium in between is combustible, it is directional, and it can be skipped over entirely by an ember on the wind. Everything below is what that one term has to account for.
What the model has to carry
Six things that decide whether a fire two miles away is your problem
 01
01Fuel gets used up
Ground that burned two years ago carries fire poorly. A road or a watercourse stops it. So the risk at your address changes as the land around you changes — without anything happening at your address at all.
 02
02Wind stretches it, slope speeds it
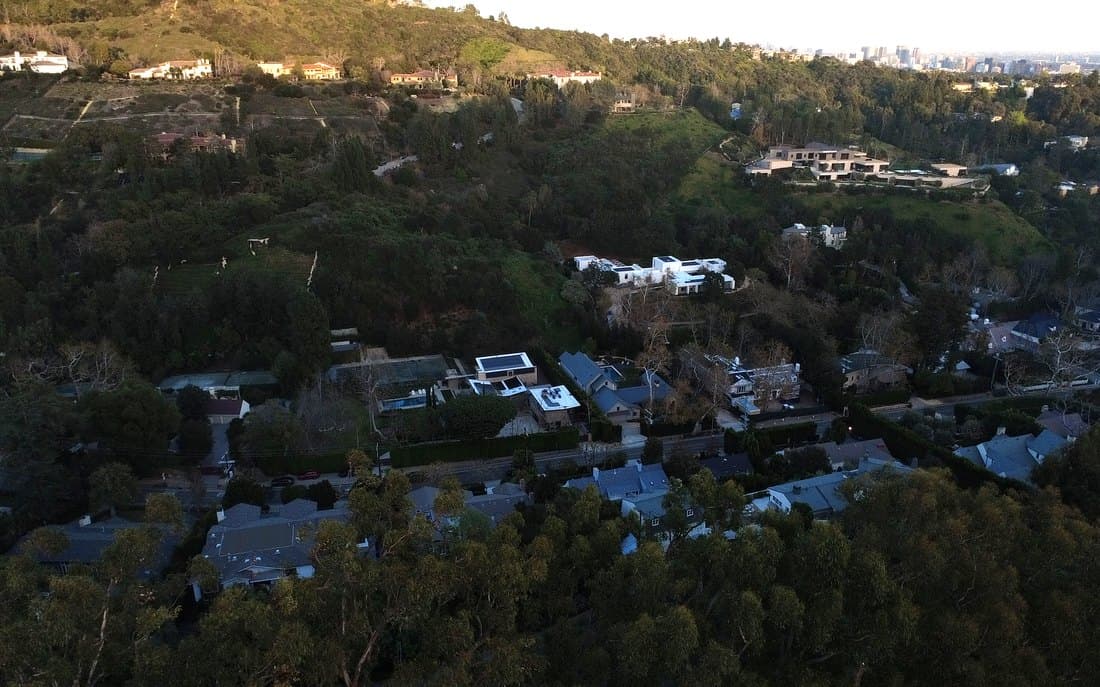
Fire does not spread as a circle. Wind elongates it downwind; it climbs far faster than it crosses or descends. Two houses on one street can carry very different risk.
 03
03Embers break the rules
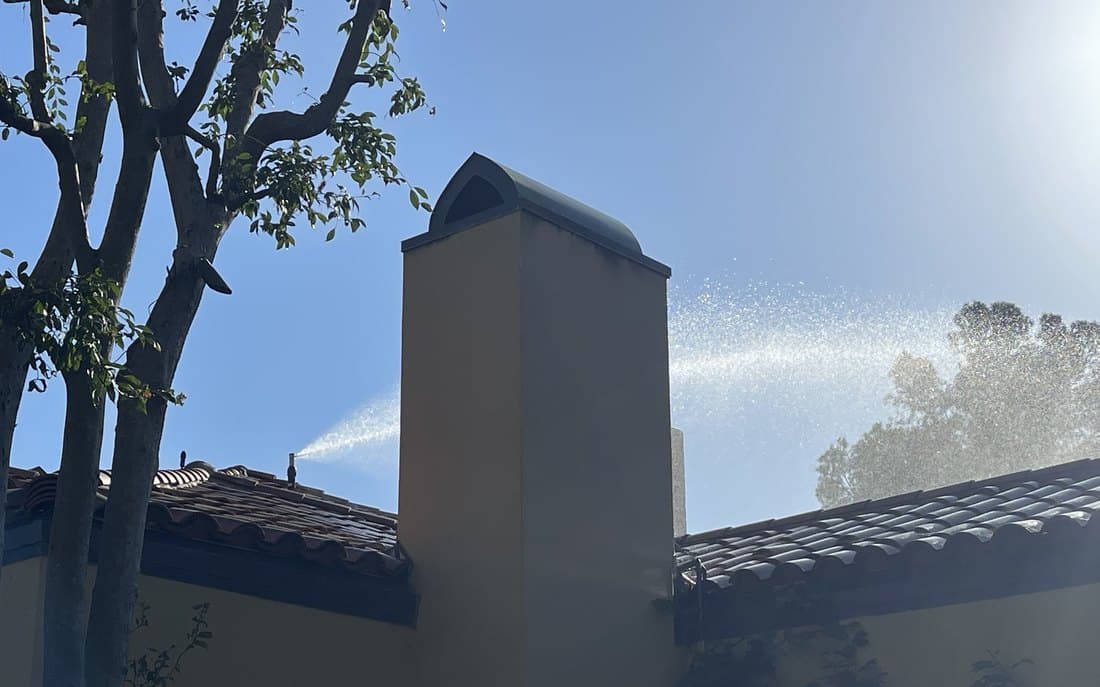
Embers travel on the wind and land well ahead of the front. That is what actually ignites houses — and it means a property can carry real risk with no unbroken line of fuel between it and the fire.
 04
04Whether anyone can get there
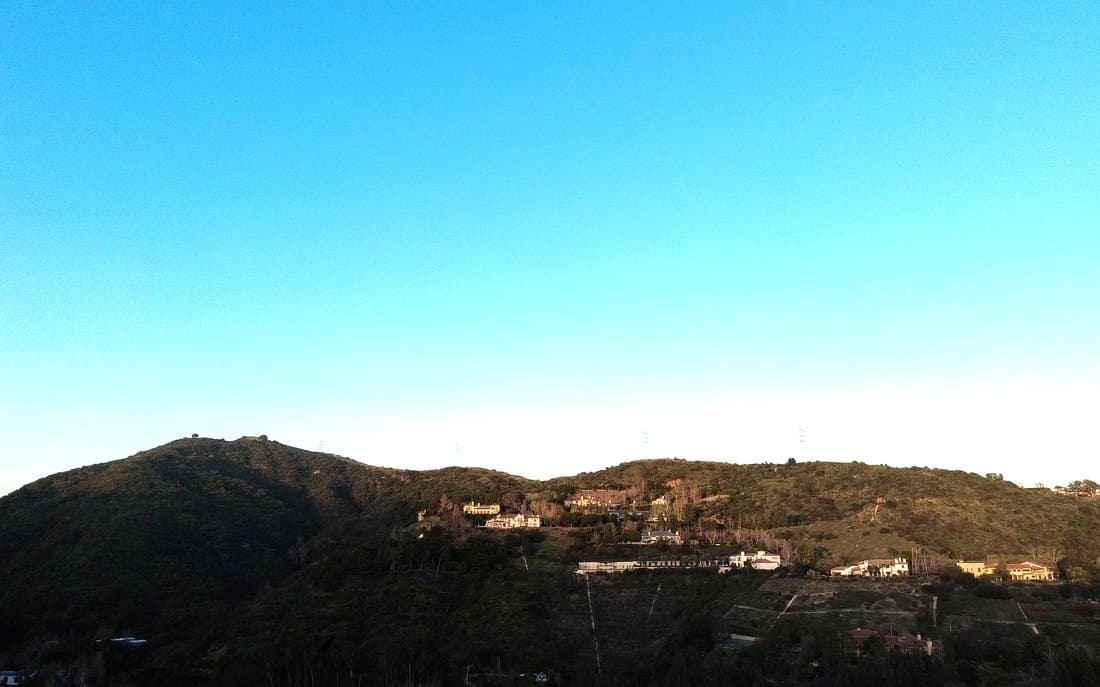
A fire gets large when spread outruns containment. In a bad wind event many fires compete for one finite pool of crews and aircraft — so the odds of a large fire rise exactly when several are burning at once.
 05
05Neighbors are fuel too
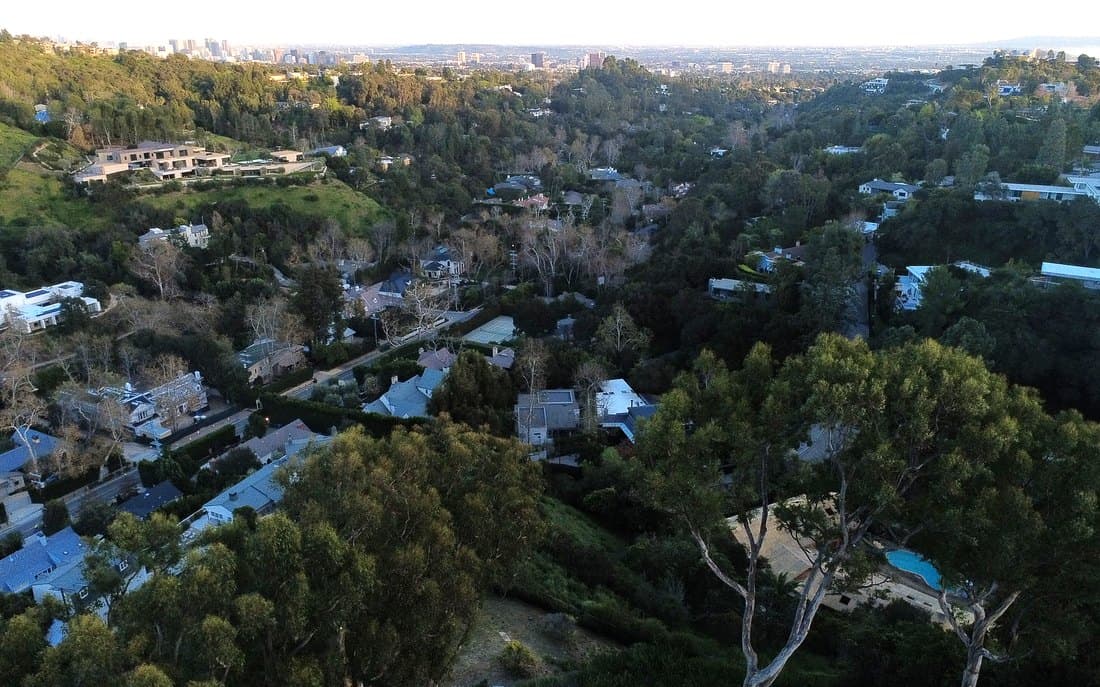
At the wildland–urban interface, structures ignite structures. On a dense street, what your neighbors have done to their roofs is part of your hazard.
 06
06Then your actual house
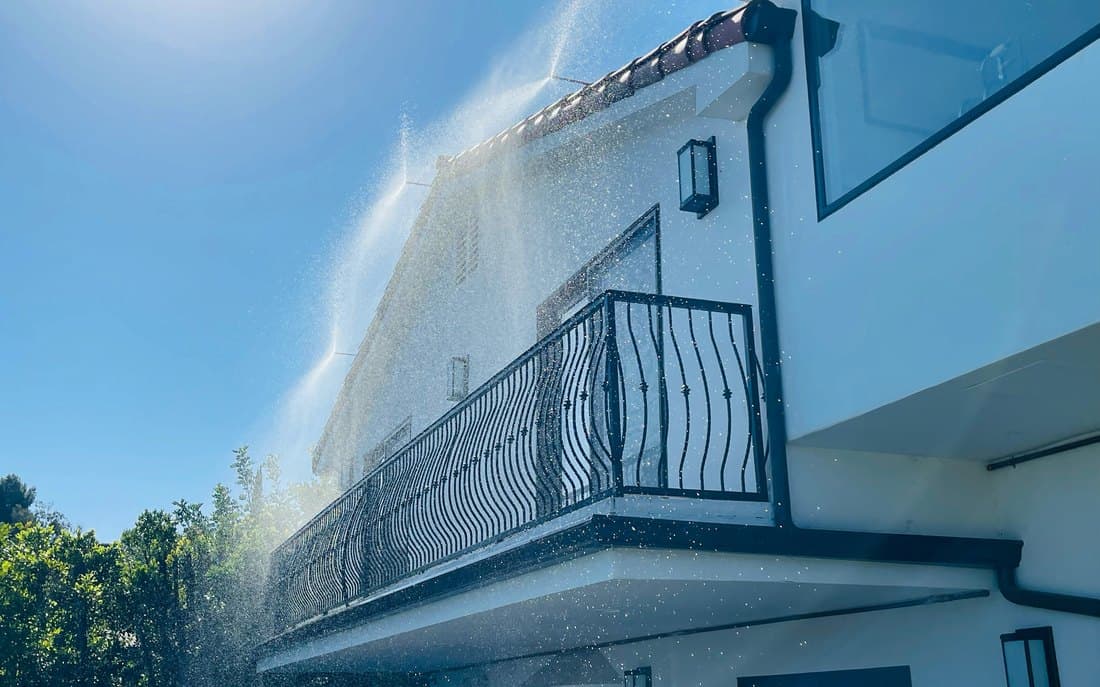
Hazard is what arrives. Damage is what that does to your building — roof, vents, eaves, siding, defensible space. Which is why the model can answer a useful question: what changes if you harden this part.
The output
Risk is not one number. It is one per house
Put those terms over real ground and the answer stops being one figure for your postcode. It becomes a value for each individual property, recomputed as conditions change.
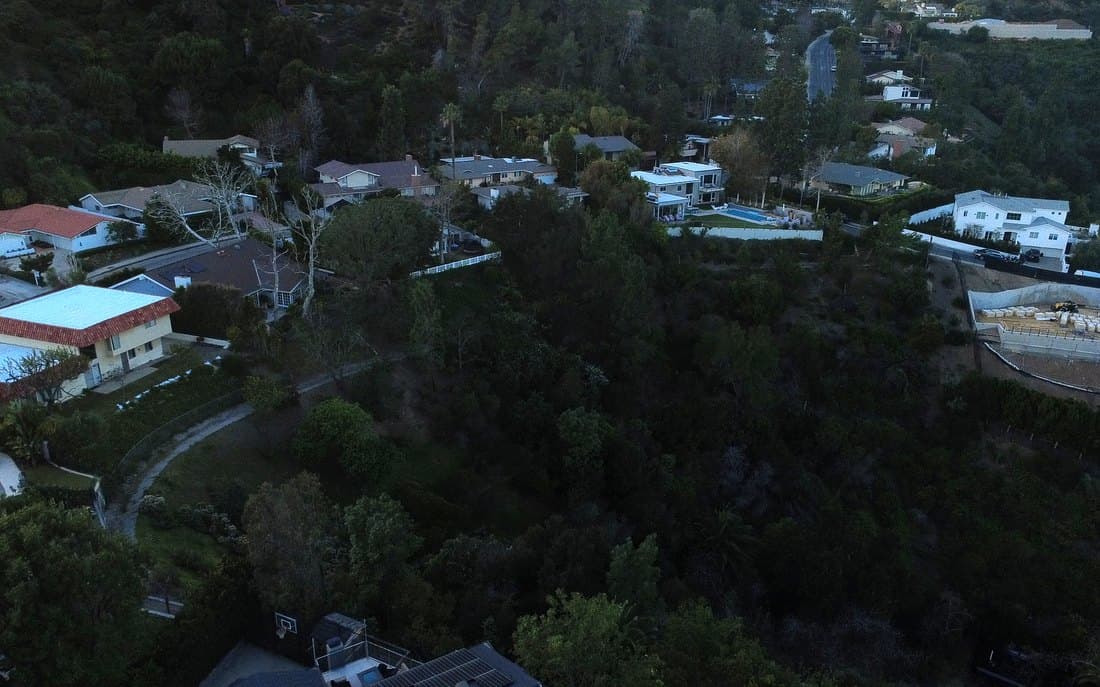
Neighbors come out differently. A house hard against the canyon edge, with continuous brush running uphill to it, carries a different number from one three doors along that sits behind other structures and a road. Same street, same fire, same distance on a map.
That is what makes it useful rather than interesting. It says which side of your property controls the number — the difference between clearing ground that matters and clearing ground that merely looks untidy.
The same discipline insurers trust
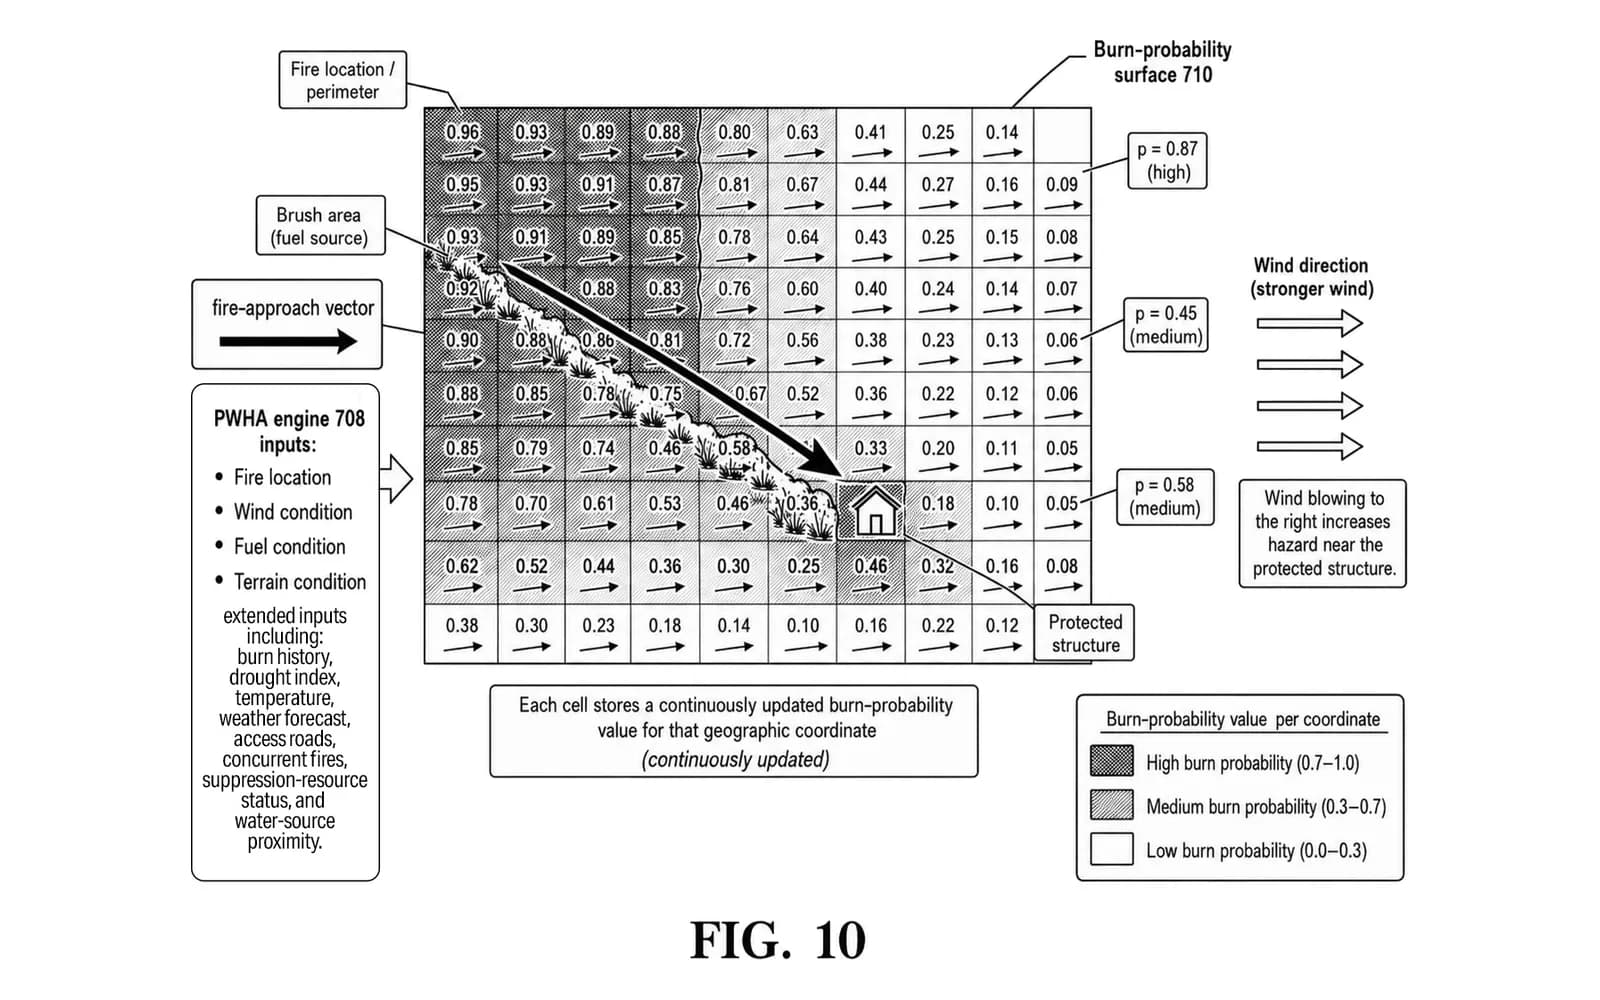
A burn probability for every coordinate around your house
Insurers and reinsurers do not price earthquake risk from a zone map. They run probabilistic catastrophe models — every plausible rupture, how often it happens, and what it does to each insured building — and set capital and premiums on the result. FireShield brings that same discipline to wildfire.
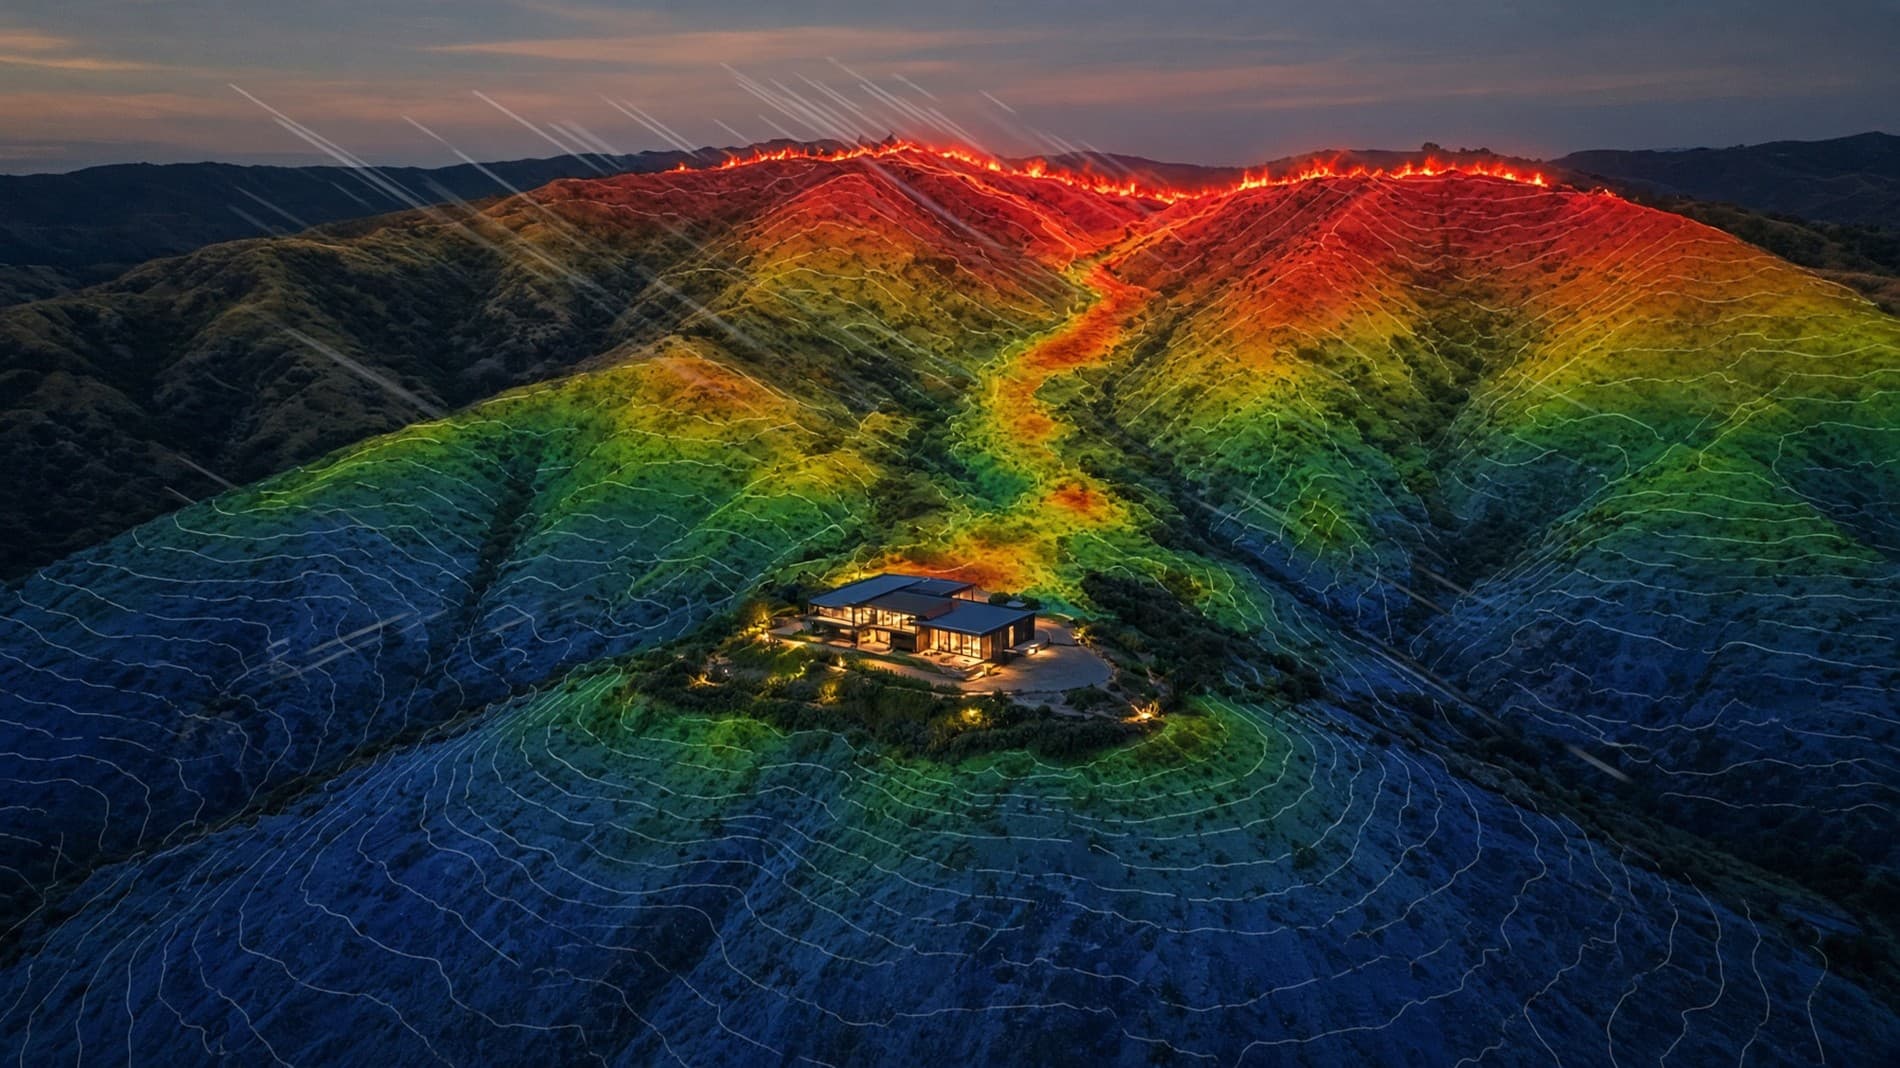
The ground around a property is divided into cells, and each one carries its own burn probability, driven by where the fire is, the wind, the fuel and the terrain, and extended with burn history, drought, forecast, access roads, concurrent fires, suppression resources and water nearby. Every cell is recomputed continuously, so the picture moves as the fire does.
It was designed by our founder, who holds a PhD in earthquake engineering and probabilistic seismic hazard analysis — the field that underpins seismic building codes and catastrophe insurance — to put that rigour to work where it helps most: protecting homes and the communities around them, and acting on the answer instead of filing it in a report.
Two clocks
One model answering two different questions
Before the season — planning
Running periodically, it produces the standing hazard for a property: how exposed it is, what is driving that, and what would change if the roof, the vents or the defensible space changed. This is the question an insurer, a builder or an owner deciding where to spend money is actually asking.
During a fire — operational
With a fire burning, the same core takes live observations — the sensed perimeter, the weather forecast, what suppression resources are committed — and works forward: how long until this reaches the property, and how likely is it to arrive at all in the next few hours. It revises as the observations do.
The two feed each other. Where a fire actually burned changes the fuel the planning model assumes next time — which is why last season quietly rewrites this season’s map.
Why this is not a dashboard
The calculation ends by opening a valve
Plenty of organizations compute wildfire risk. The output is almost always a map, a score or a premium. FireShield’s connects to physical hardware at the property: the same analysis that produces the number also decides that water should be moving, and starts it.
That connection — a per-property hazard analysis coupled directly to actuation rather than to a display — is the subject of our original patent filing.
This page describes the shape of the model, not its implementation: which quantities go in, what comes out, and why each term is there. No system can eliminate wildfire risk, and no model can predict a particular fire. Both reduce the chance of being surprised.