FireShield research · PWHA
Future of Wildfire: Predictive Models
FireShield PWHA (Probabilistic Wildfire Hazard Analysis) is our research into a wildfire’s next move. It uses established fire-behavior science and hazard methods, not guesswork, to estimate where a fire is likely to be over the next six hours, updated every minute.
What it reads
Everything that moves a fire, stacked together
Firefighters have always read the land, the weather, the fire itself and each other’s work. FireShield PWHA brings every relevant source together, from satellites, weather stations, land surveys and incident records, for every spot on the map, around the clock.
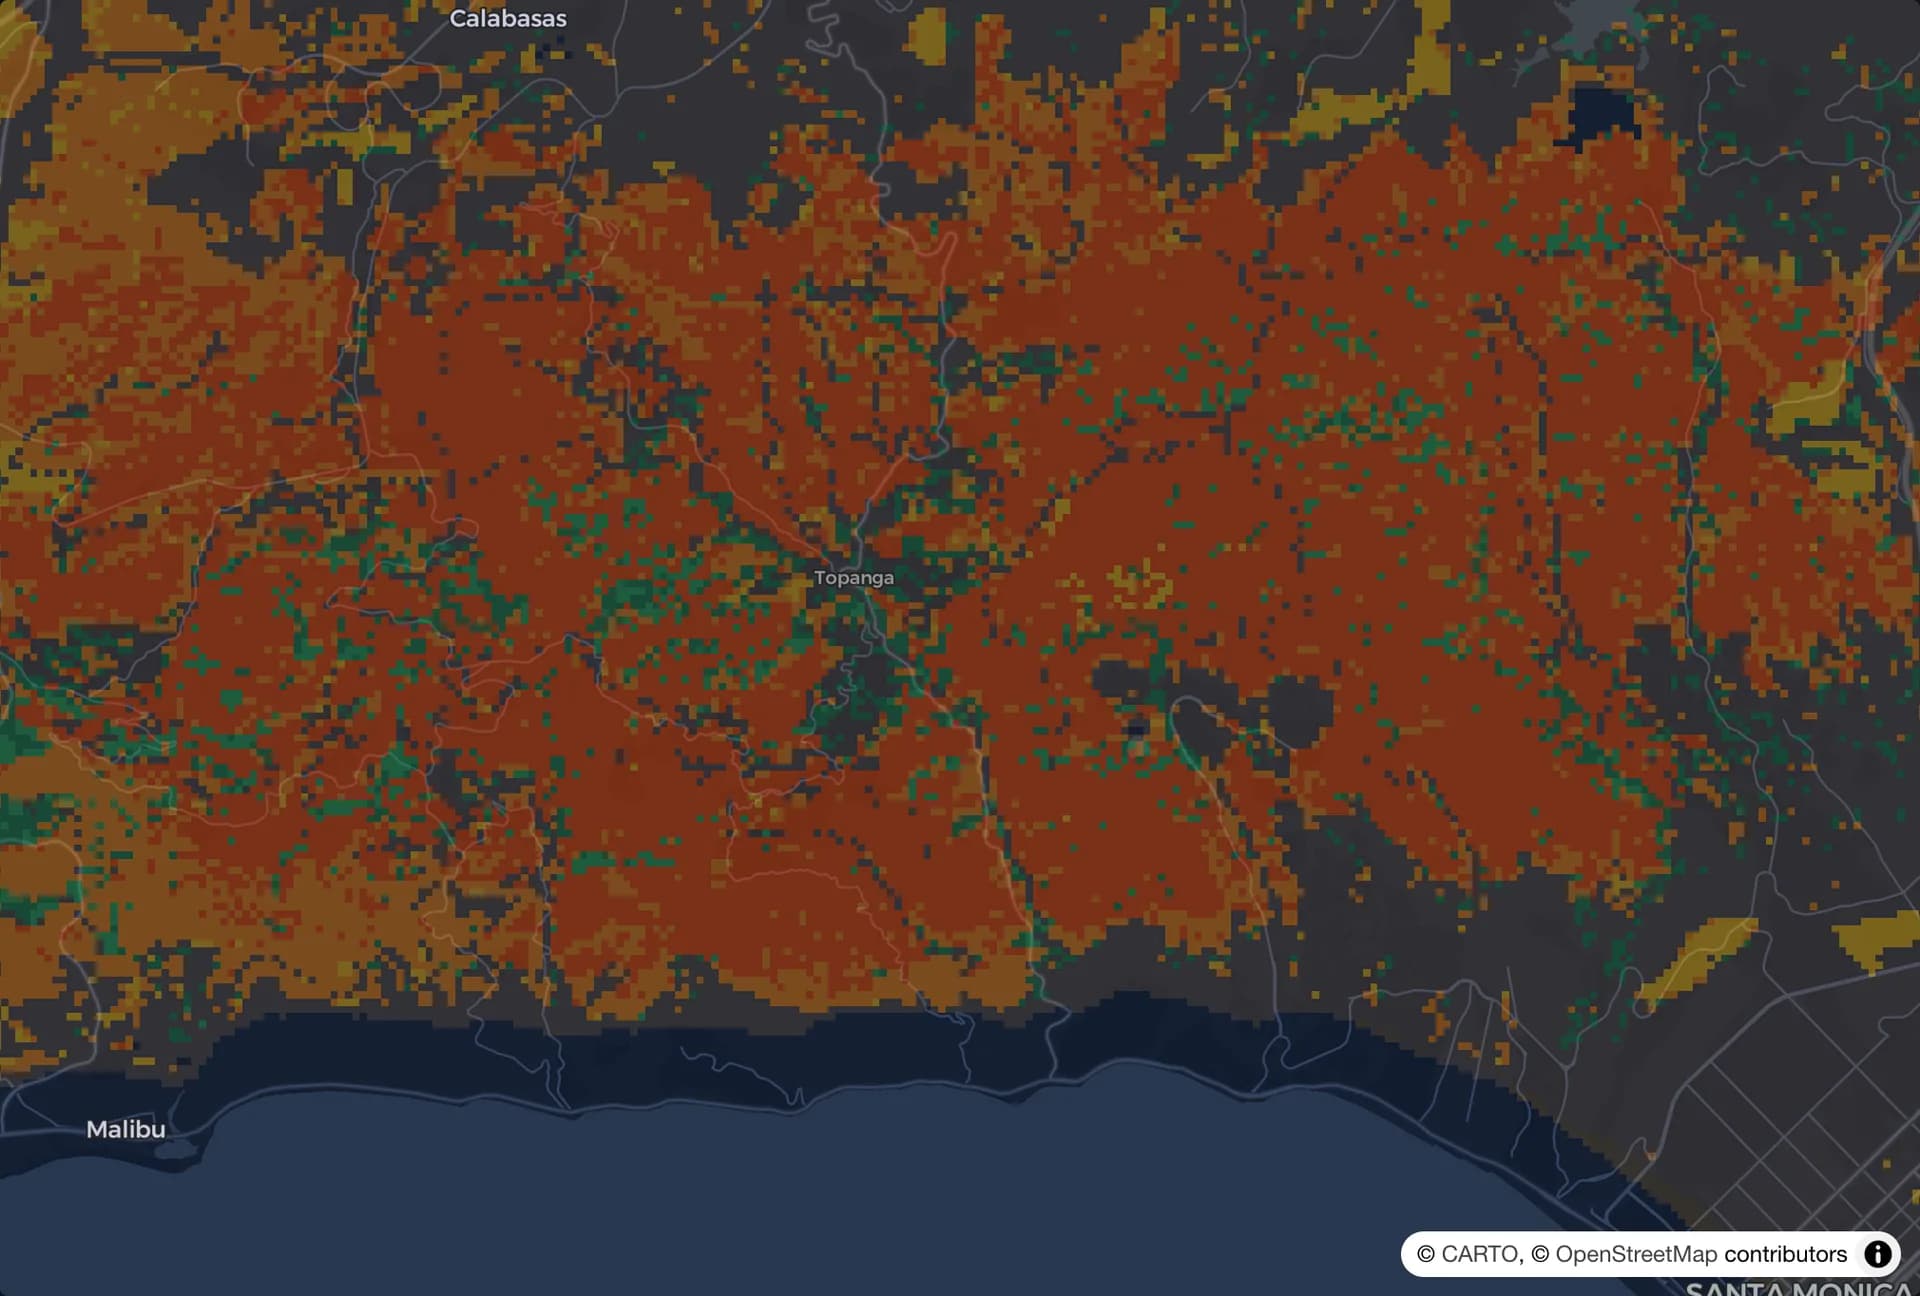
Fuel
What is on the ground to burn, from grass to thick brush, mapped across the whole area.
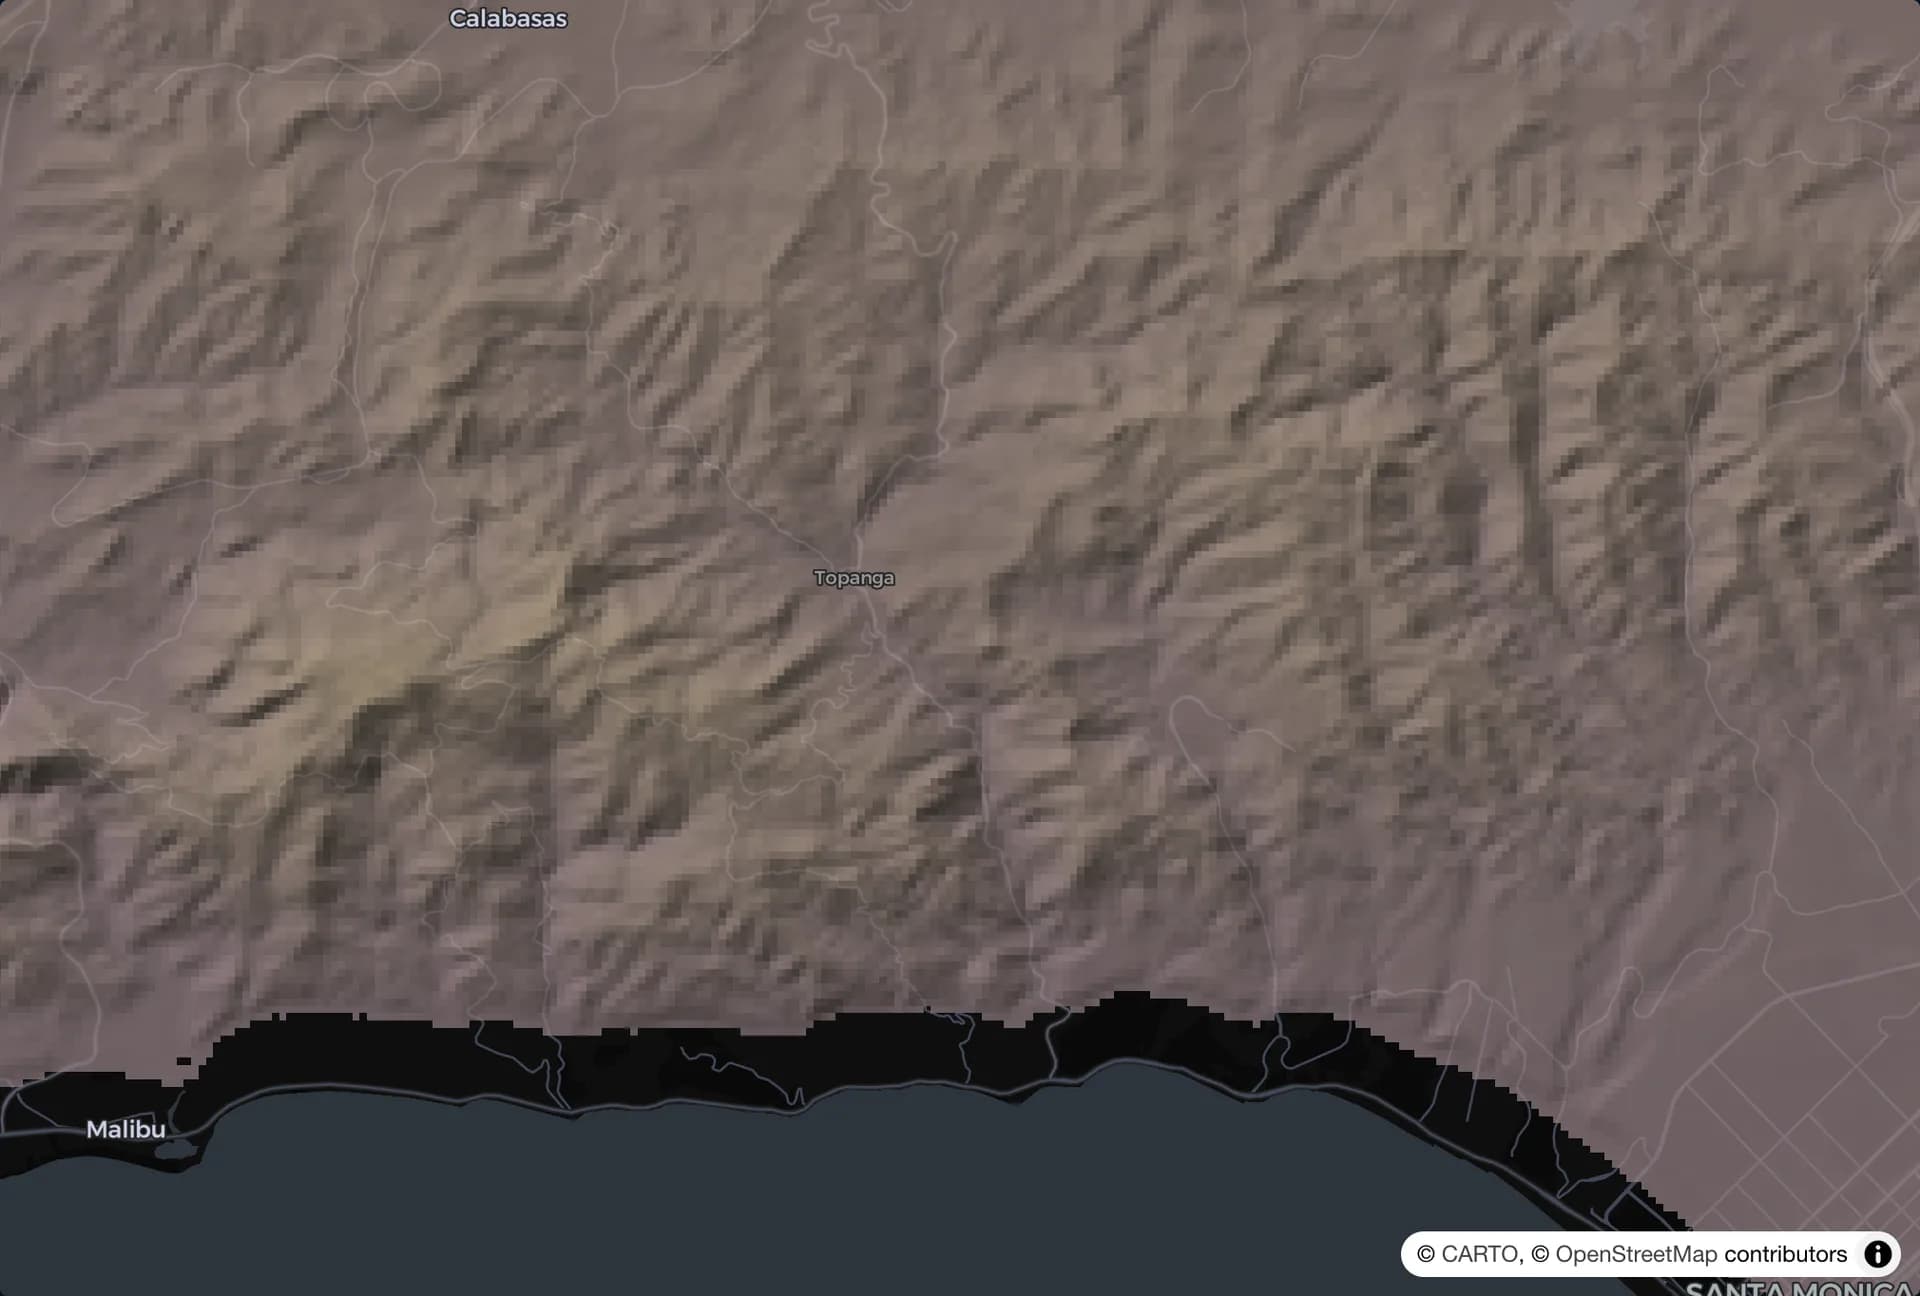
Terrain
Fire runs uphill and through canyons. Every slope and ridge is part of the picture.
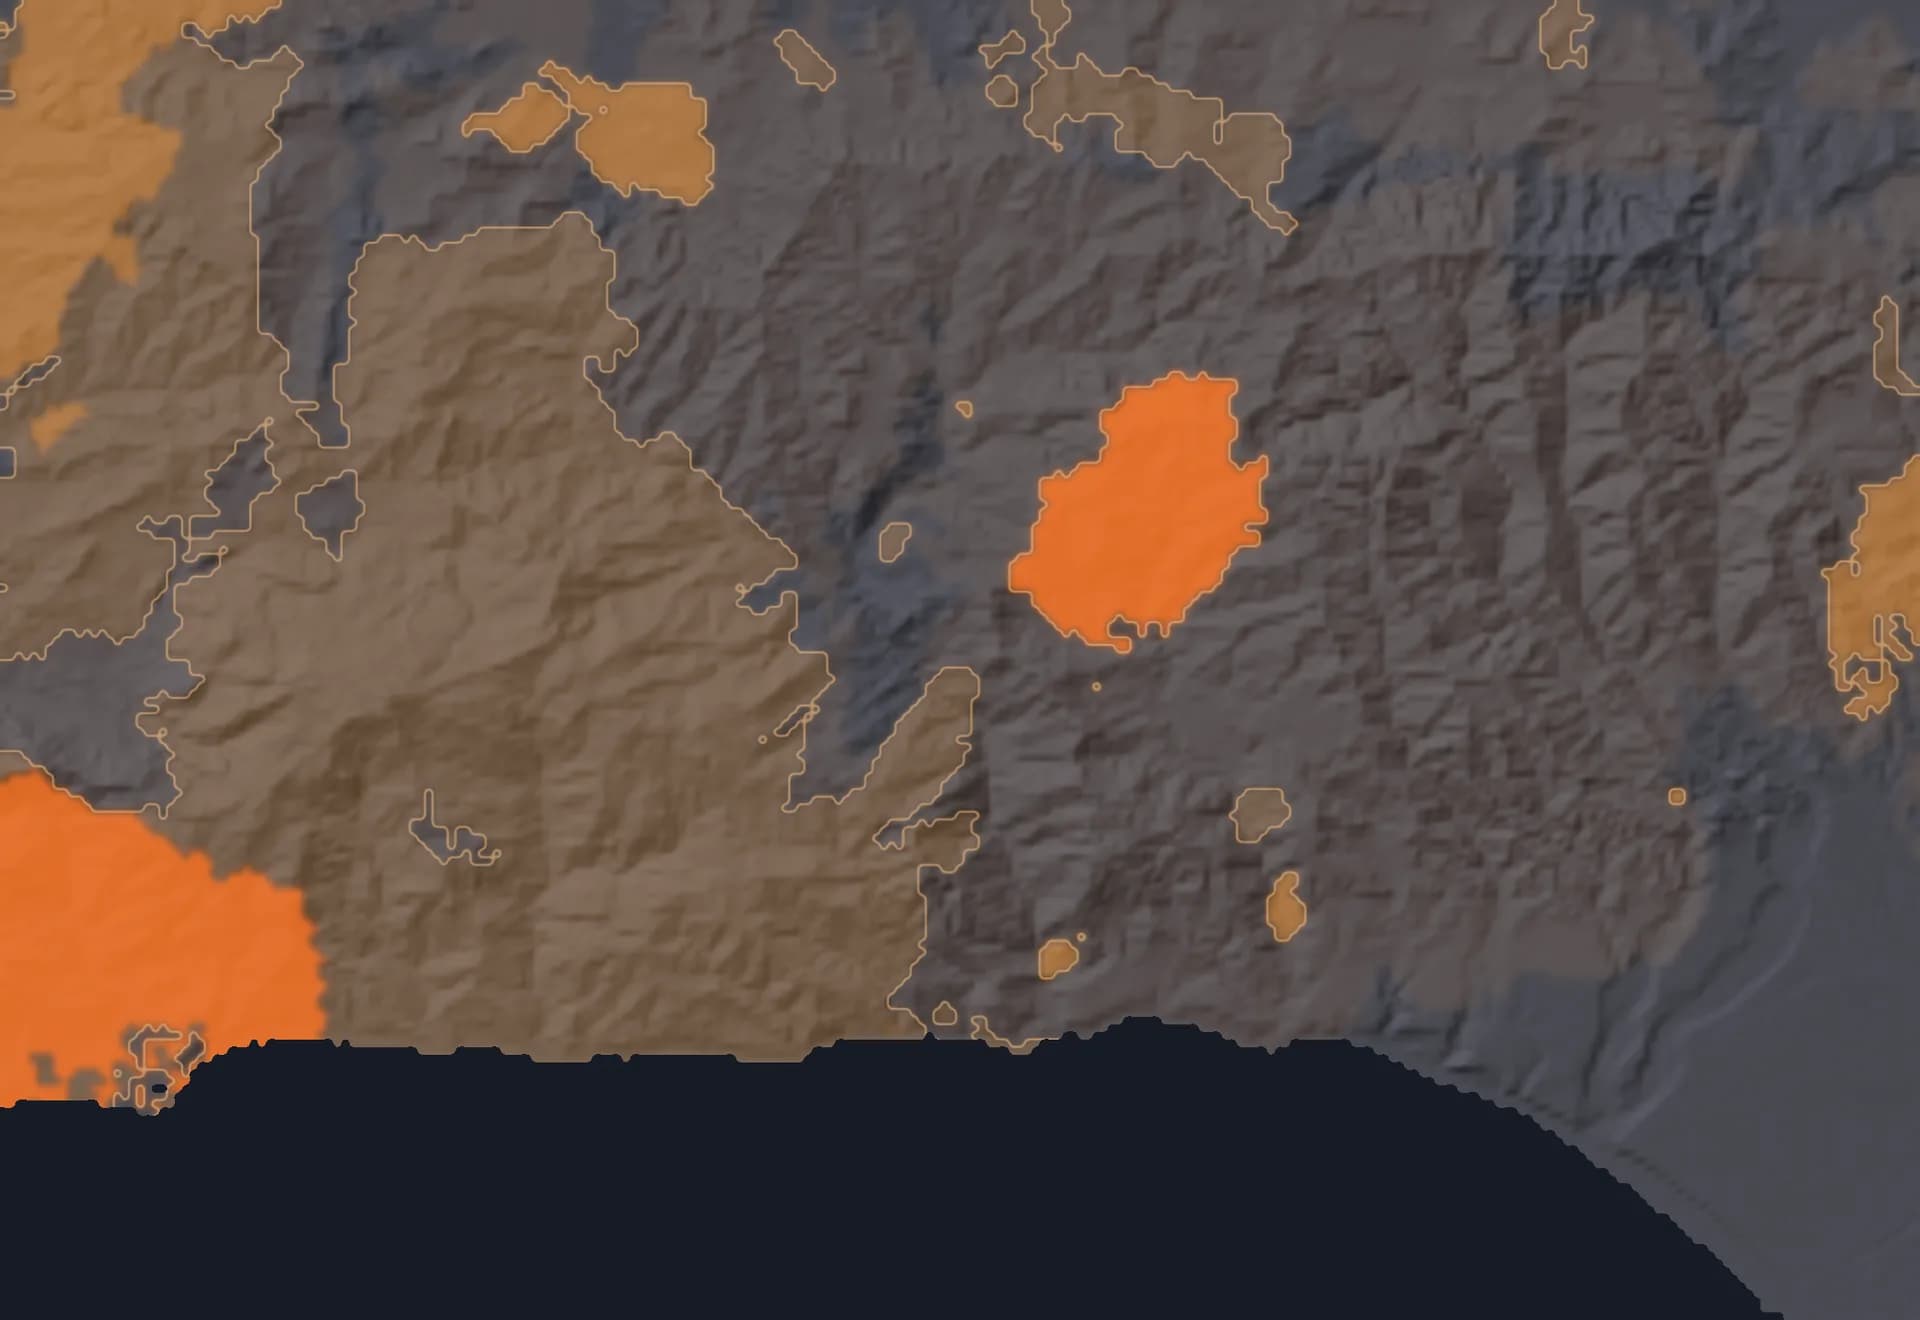
Fire history
Land that burned recently has less to burn. Land that has not burned in decades has more.
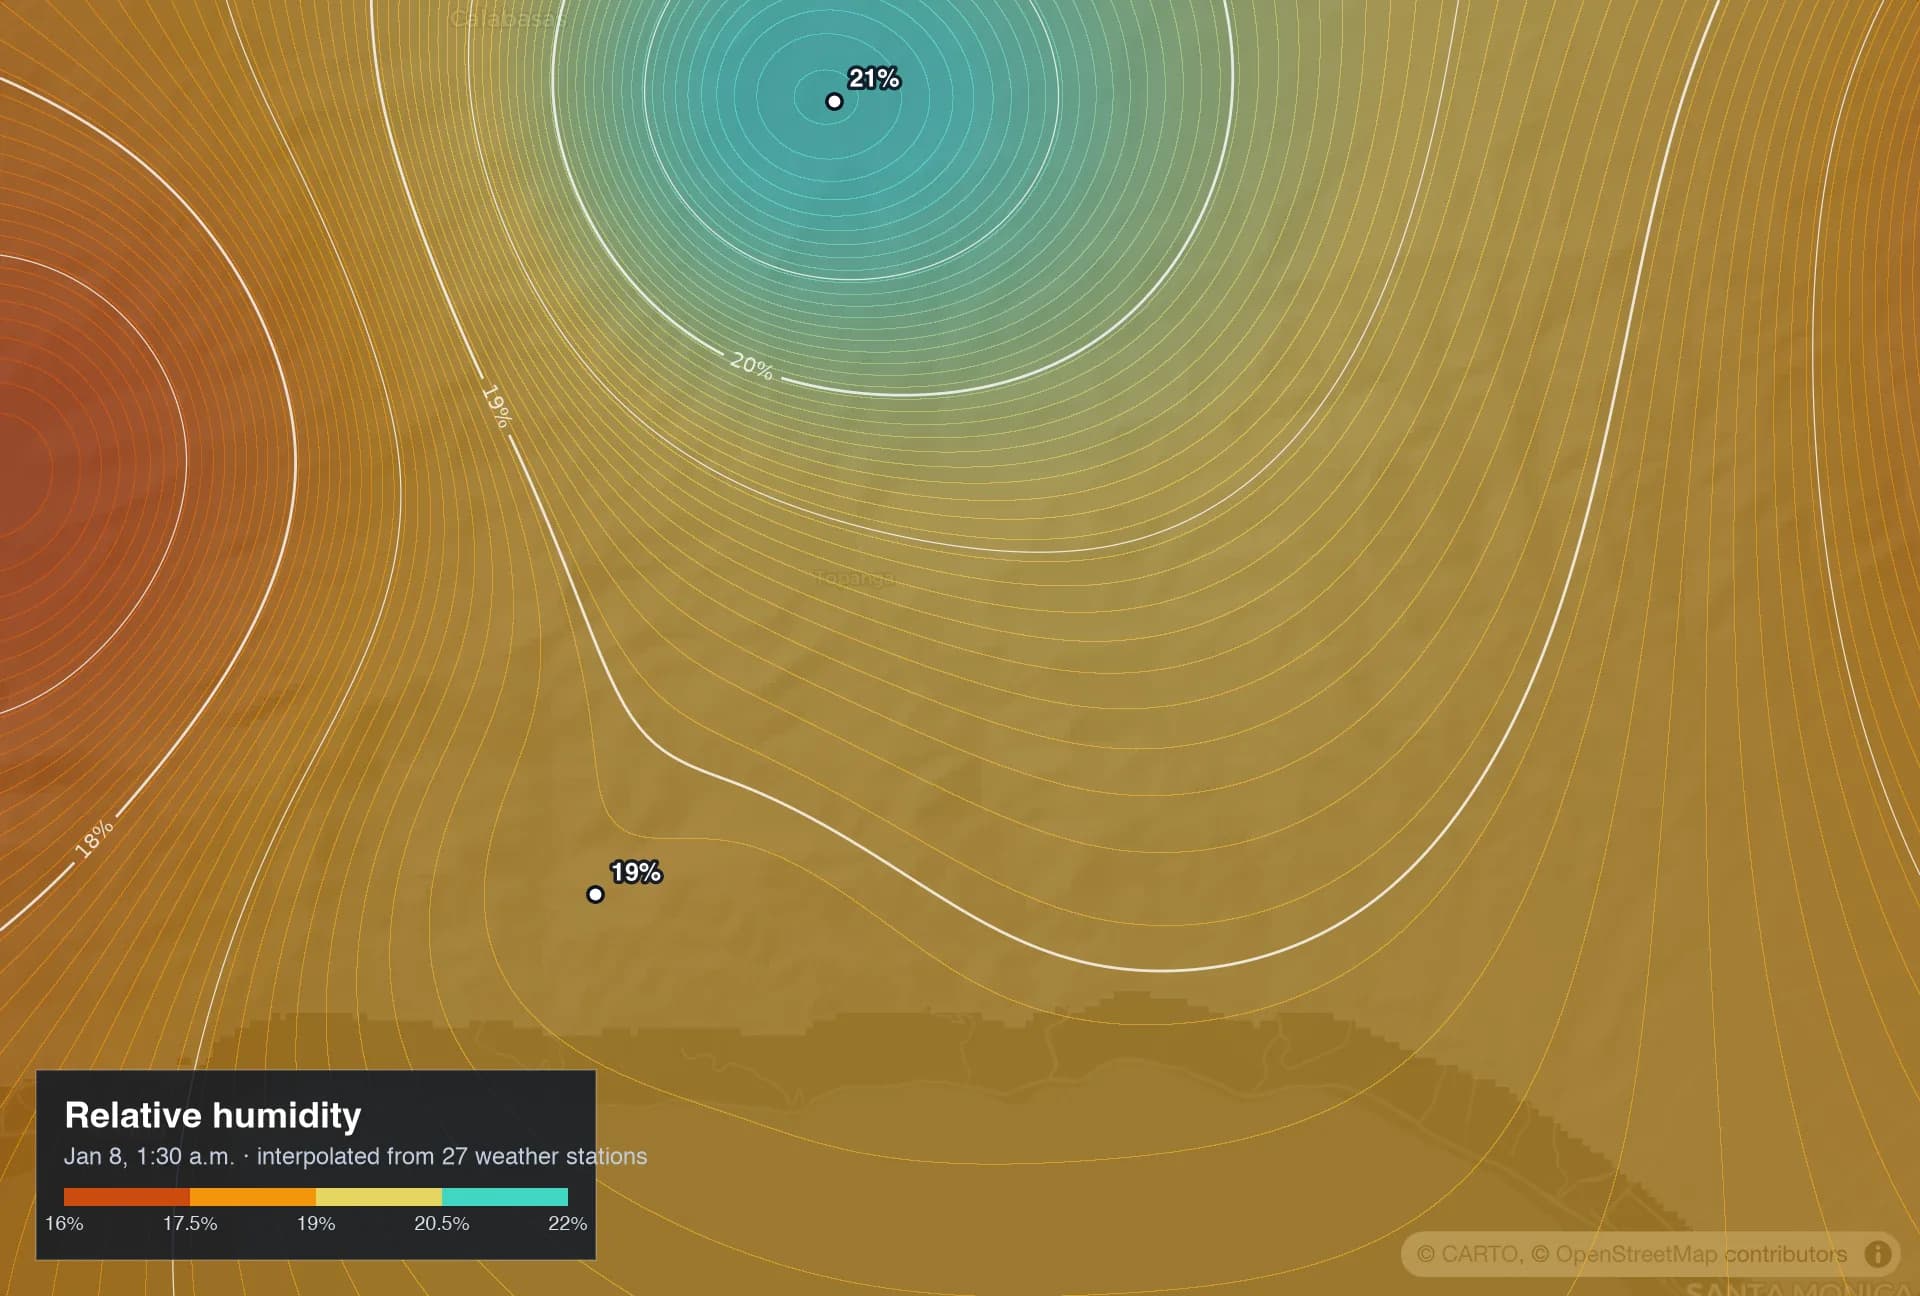
Humidity
How dry the air is, mapped from every nearby weather station. Dry air pulls water out of plants.
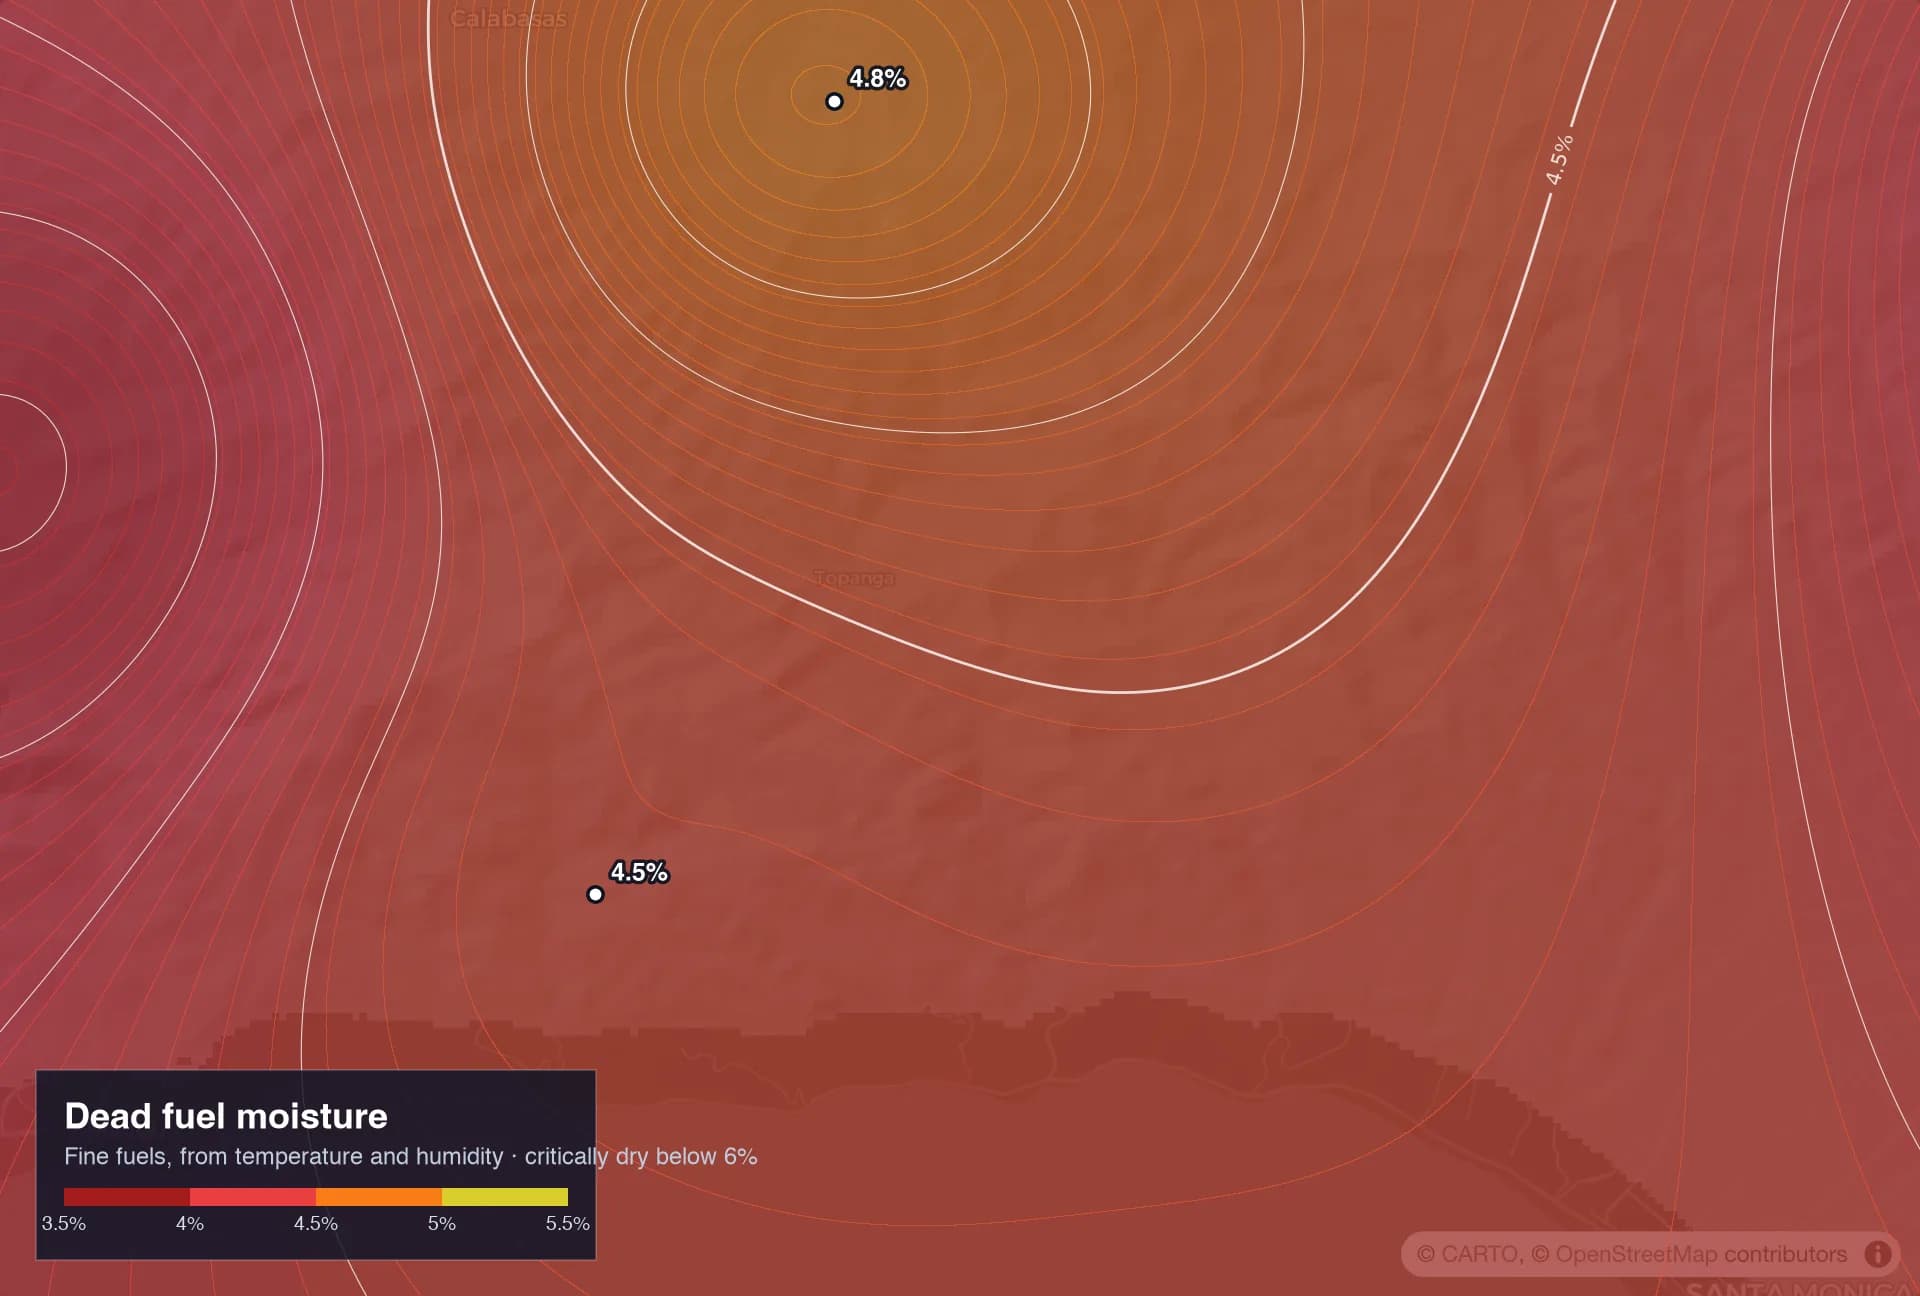
Fuel moisture
How dry the dead grass, leaves and twigs are right now. The drier they are, the faster fire spreads.
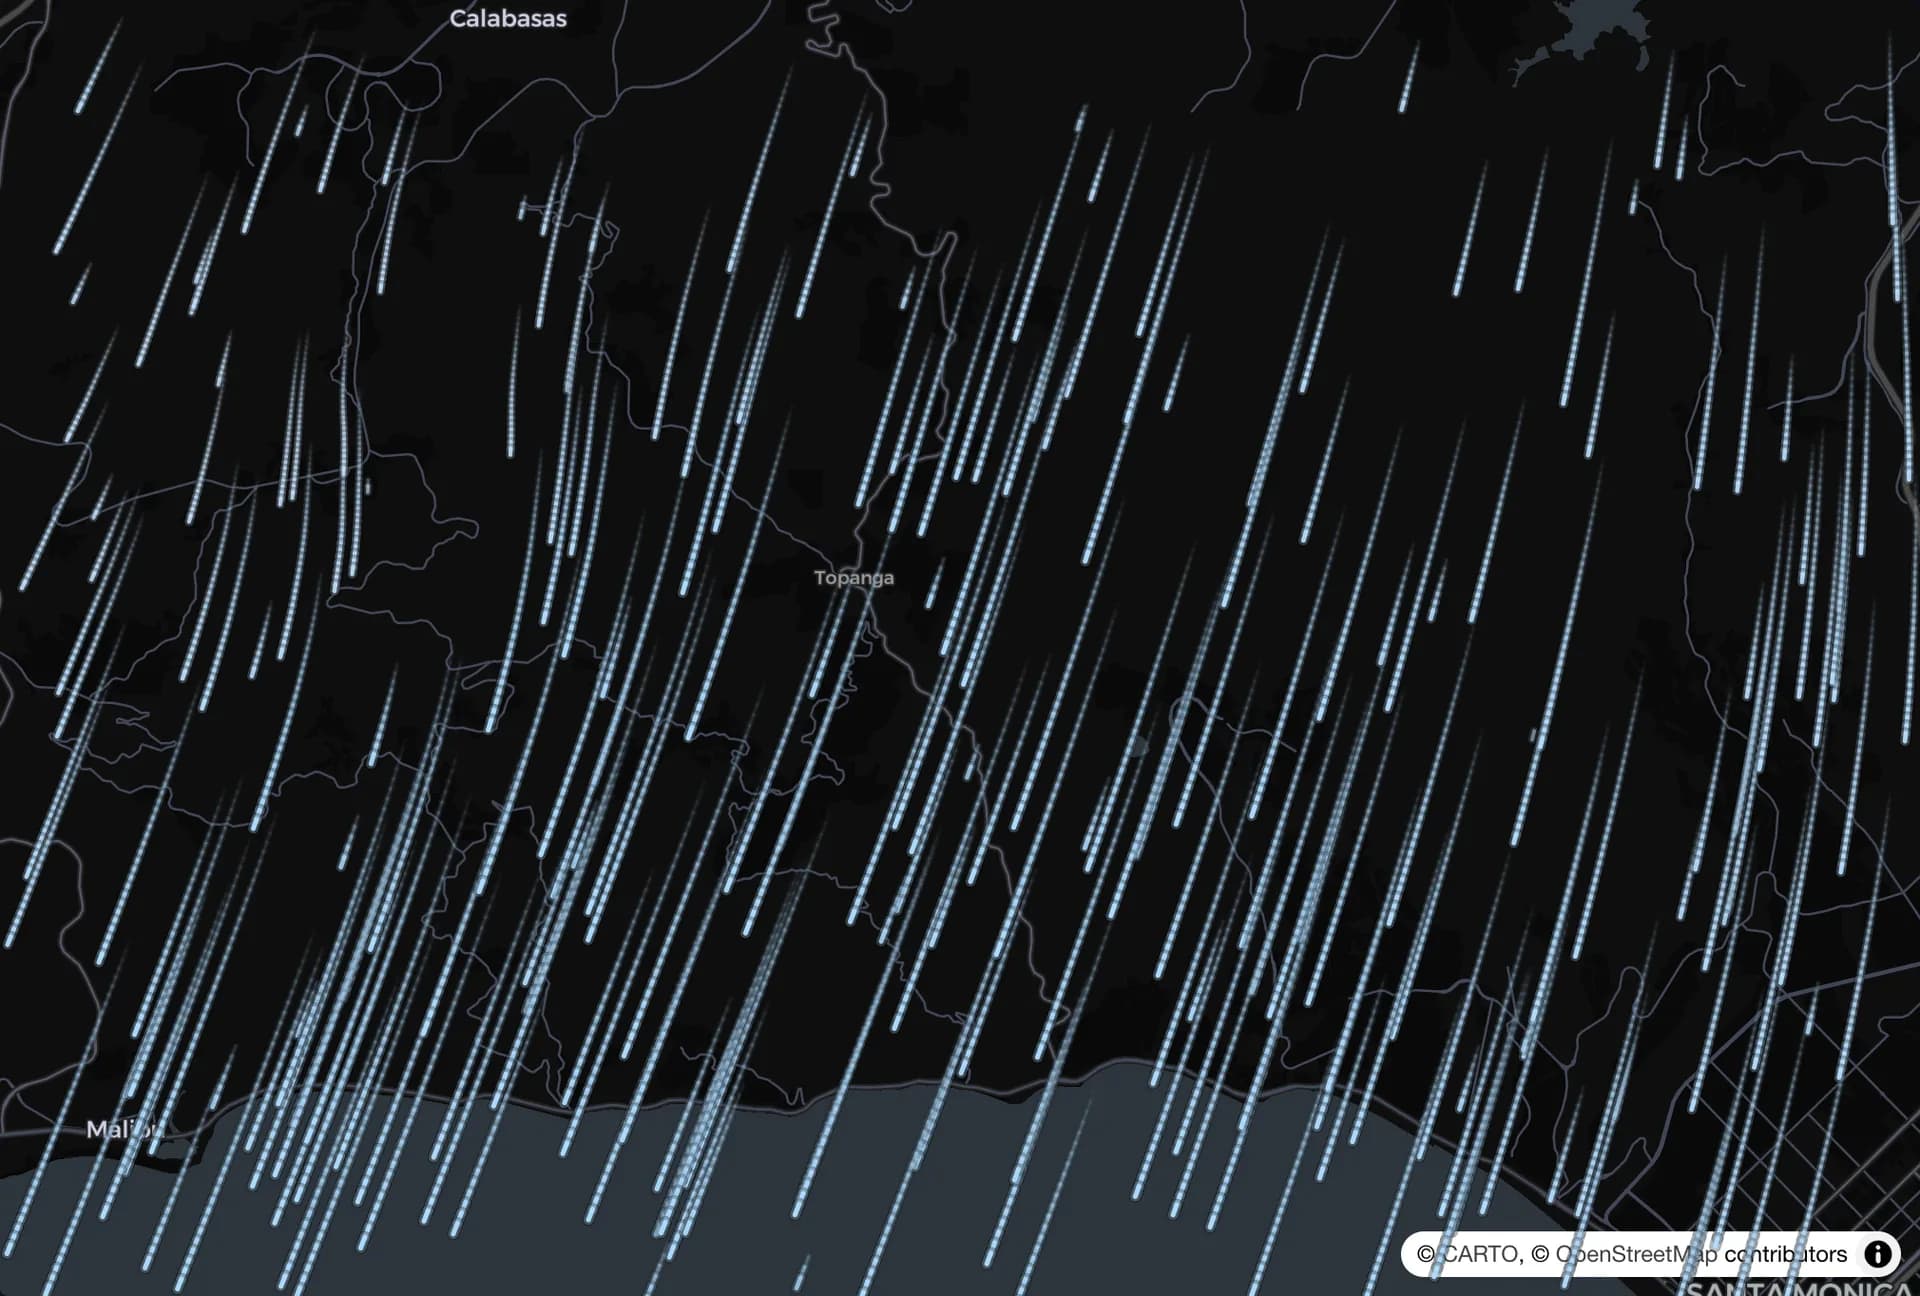
Wind now
Speed, gusts and direction, minute by minute. Wind is the biggest single driver of a fast fire.
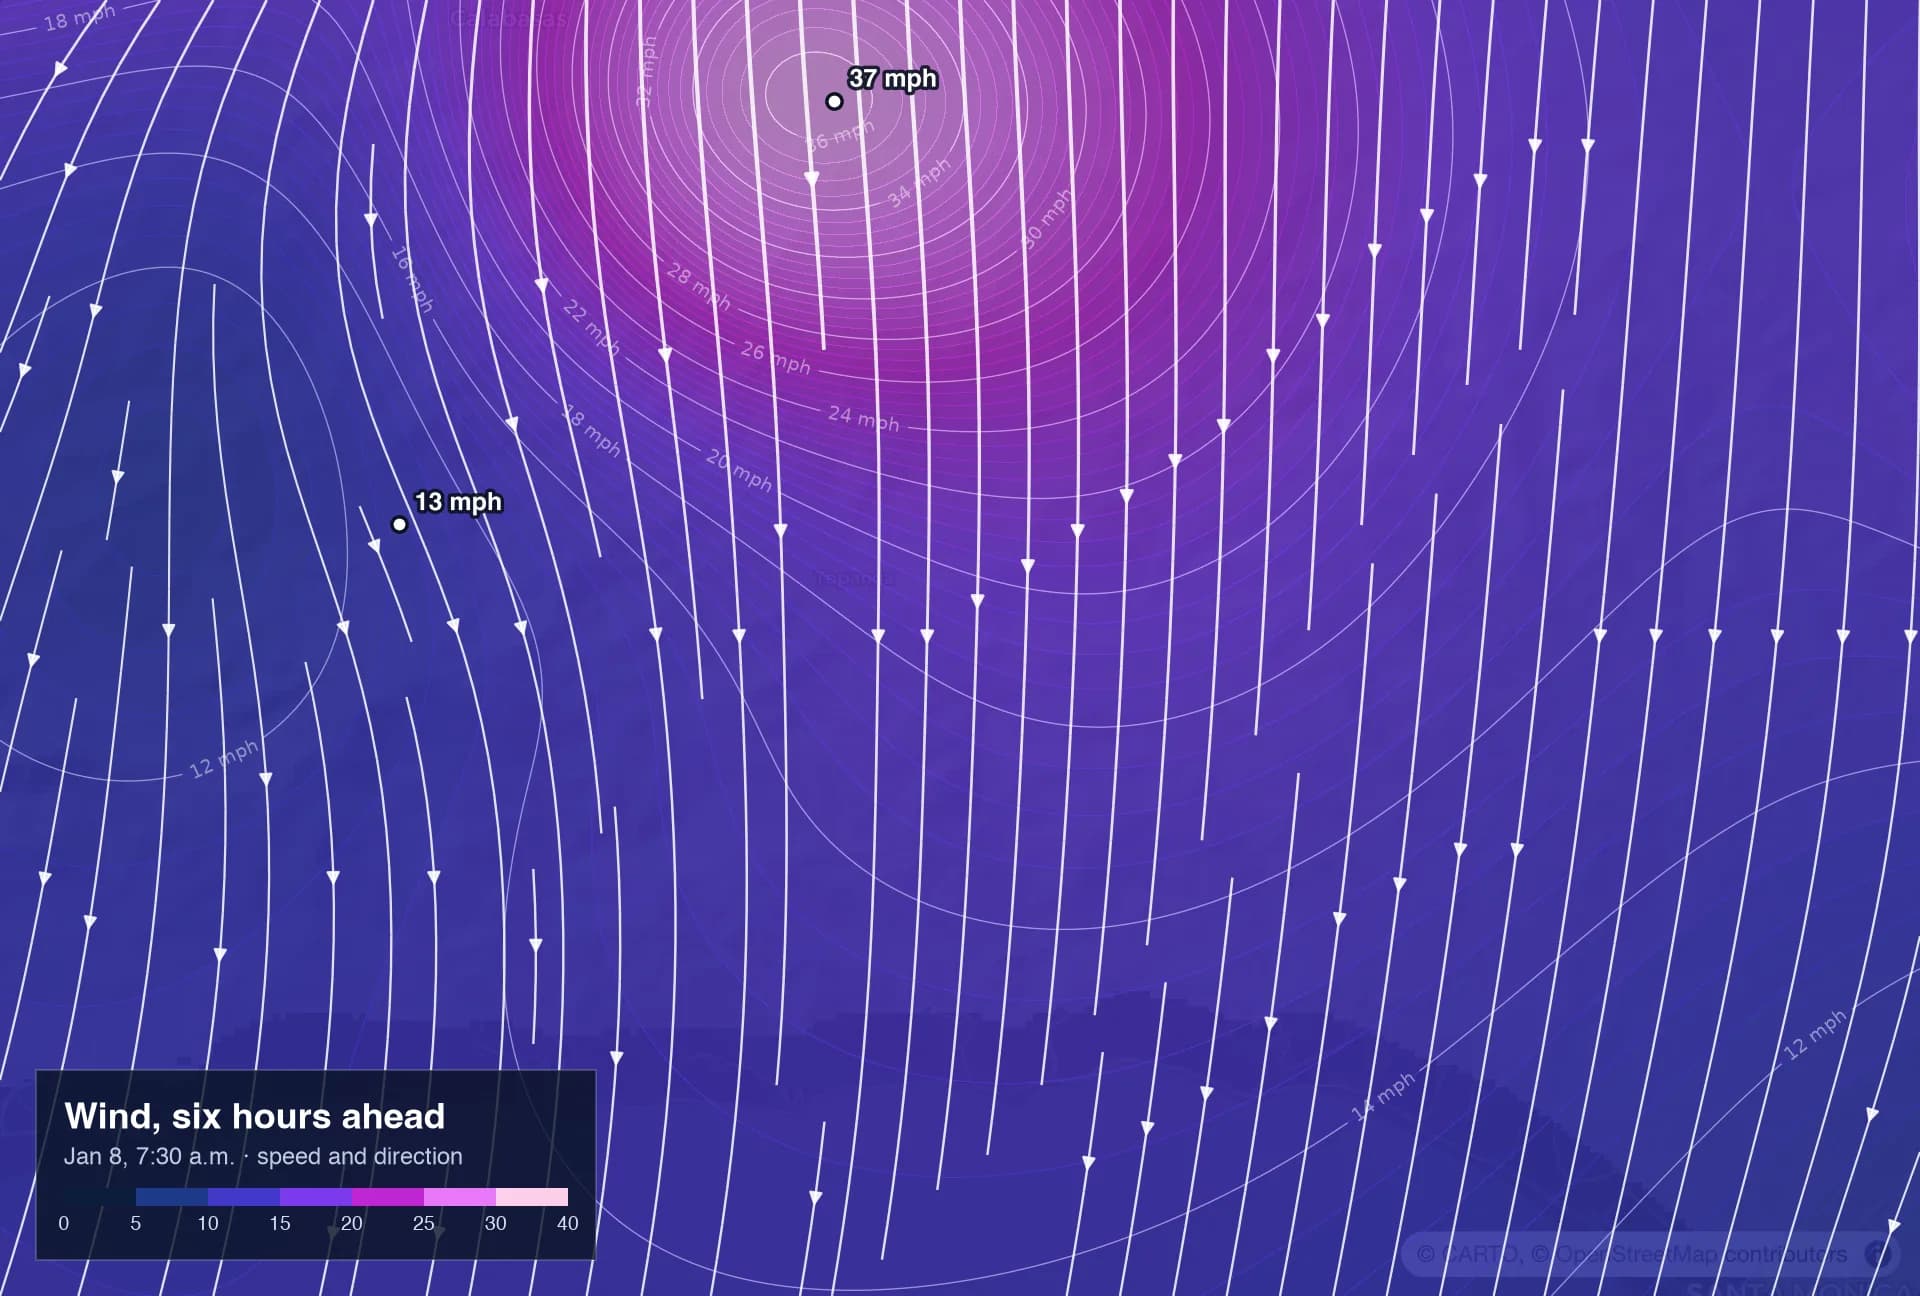
Wind ahead
Where the wind is heading over the next hours, not just where it is now. The forecast moves with it.
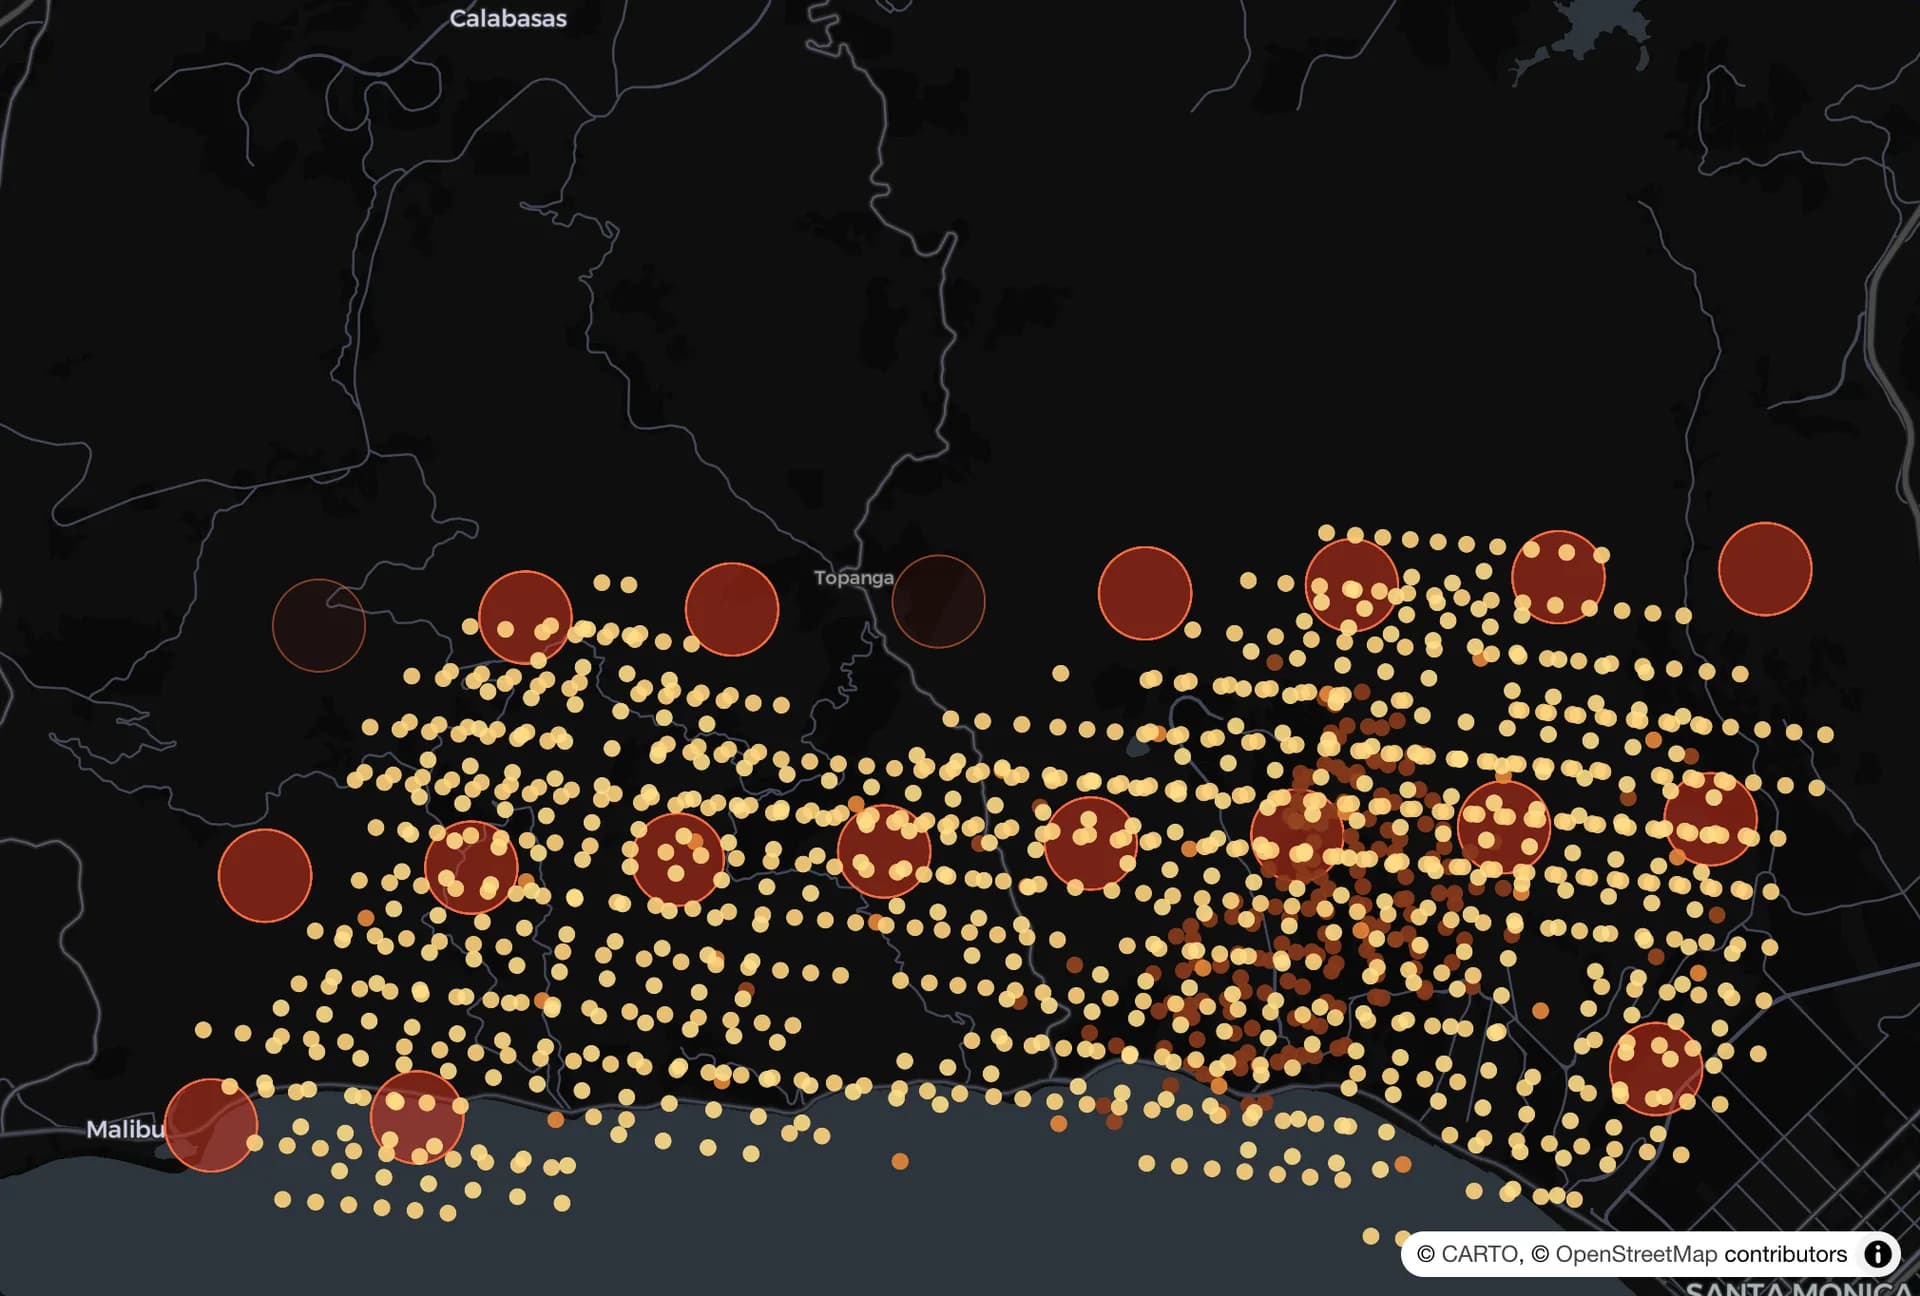
Satellite heat
Satellites see the fire’s heat every minute. That keeps the forecast honest as the fire changes.
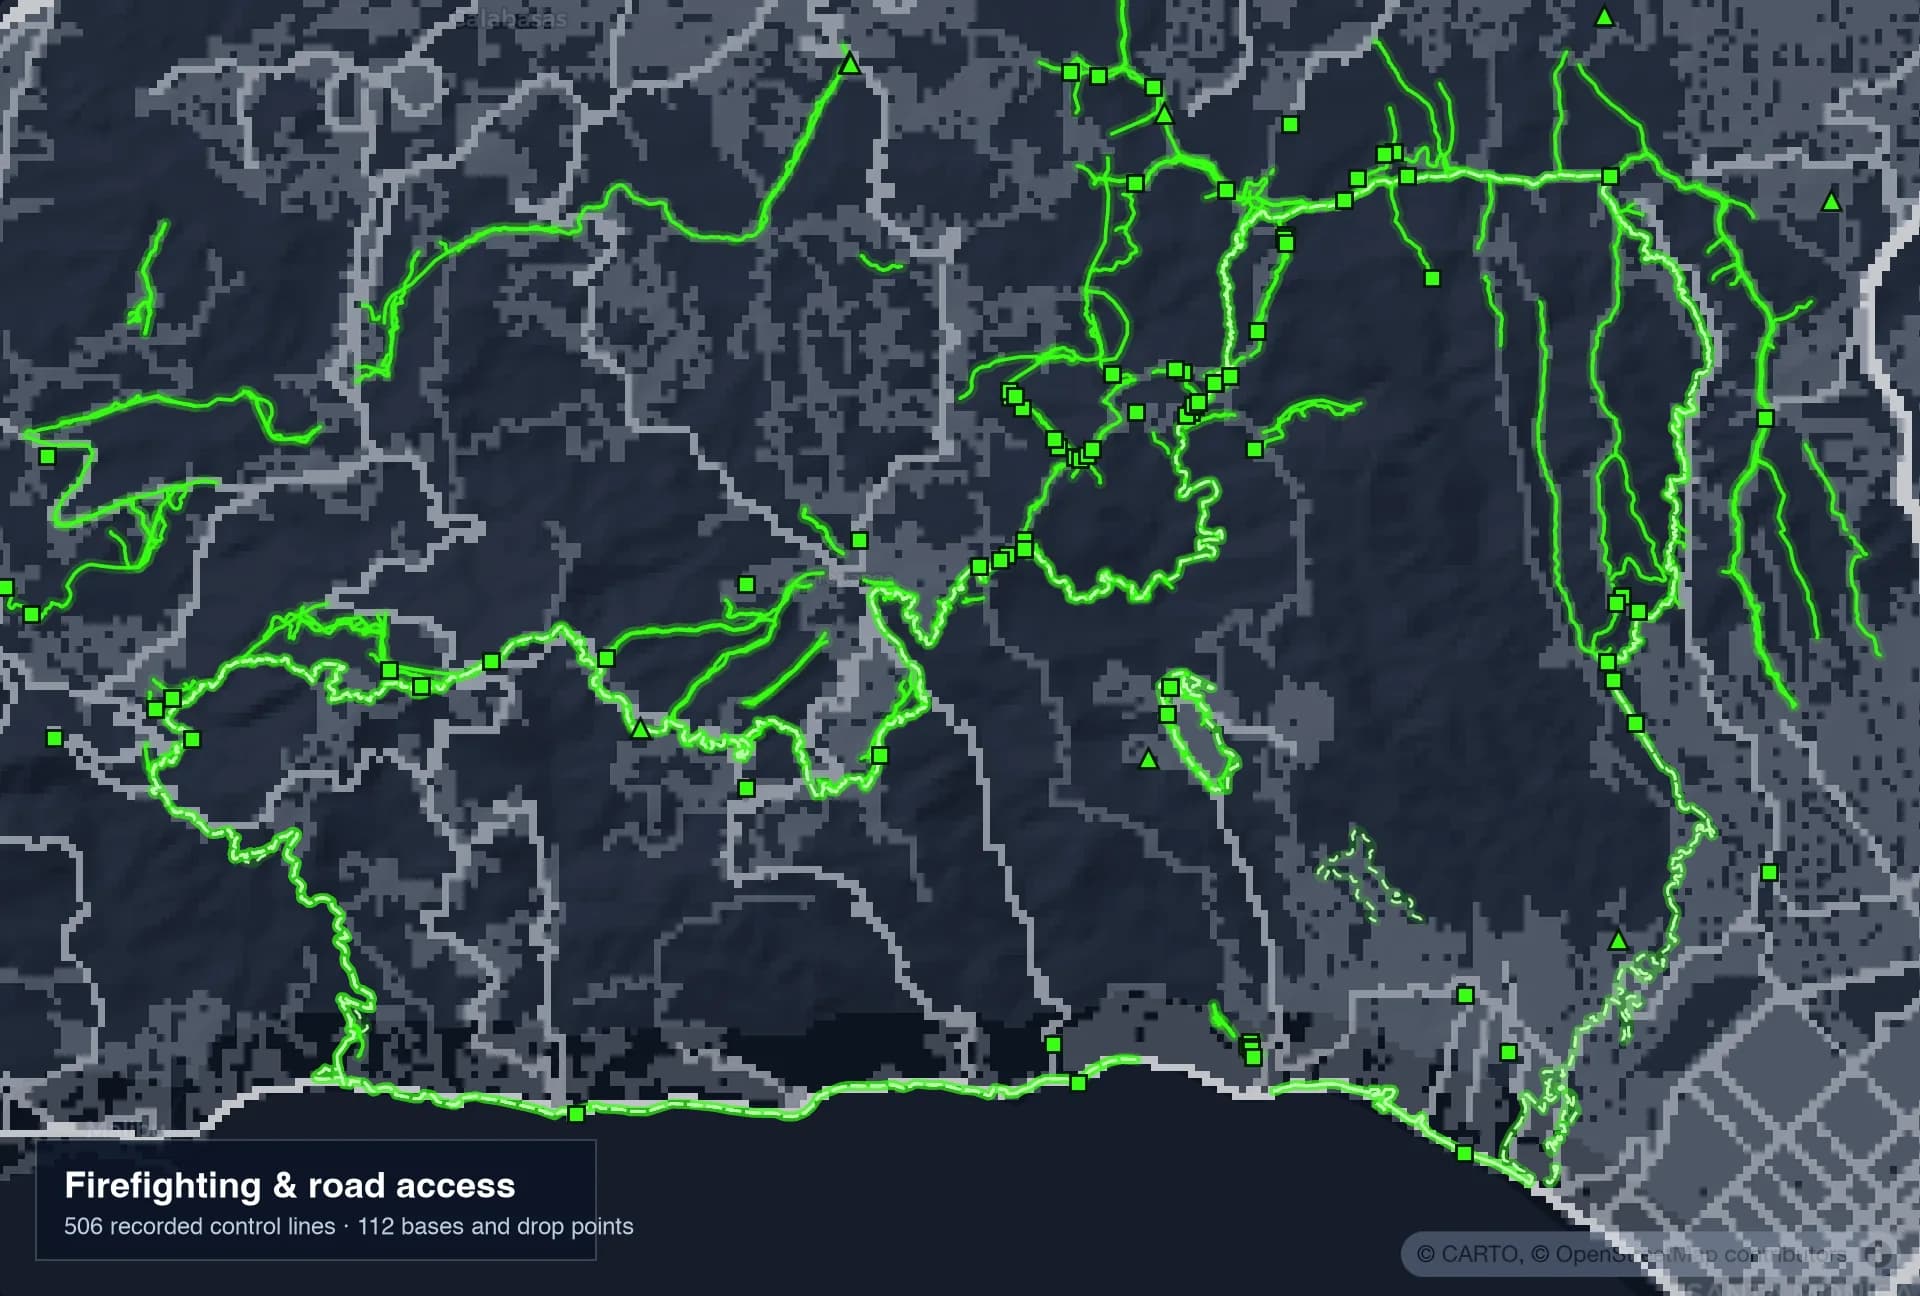
Firefighting and roads
Dozer and hand lines, contained edges, air bases and the roads crews use. Human effort changes where a fire can go.
All together
One forecast: where the fire will be
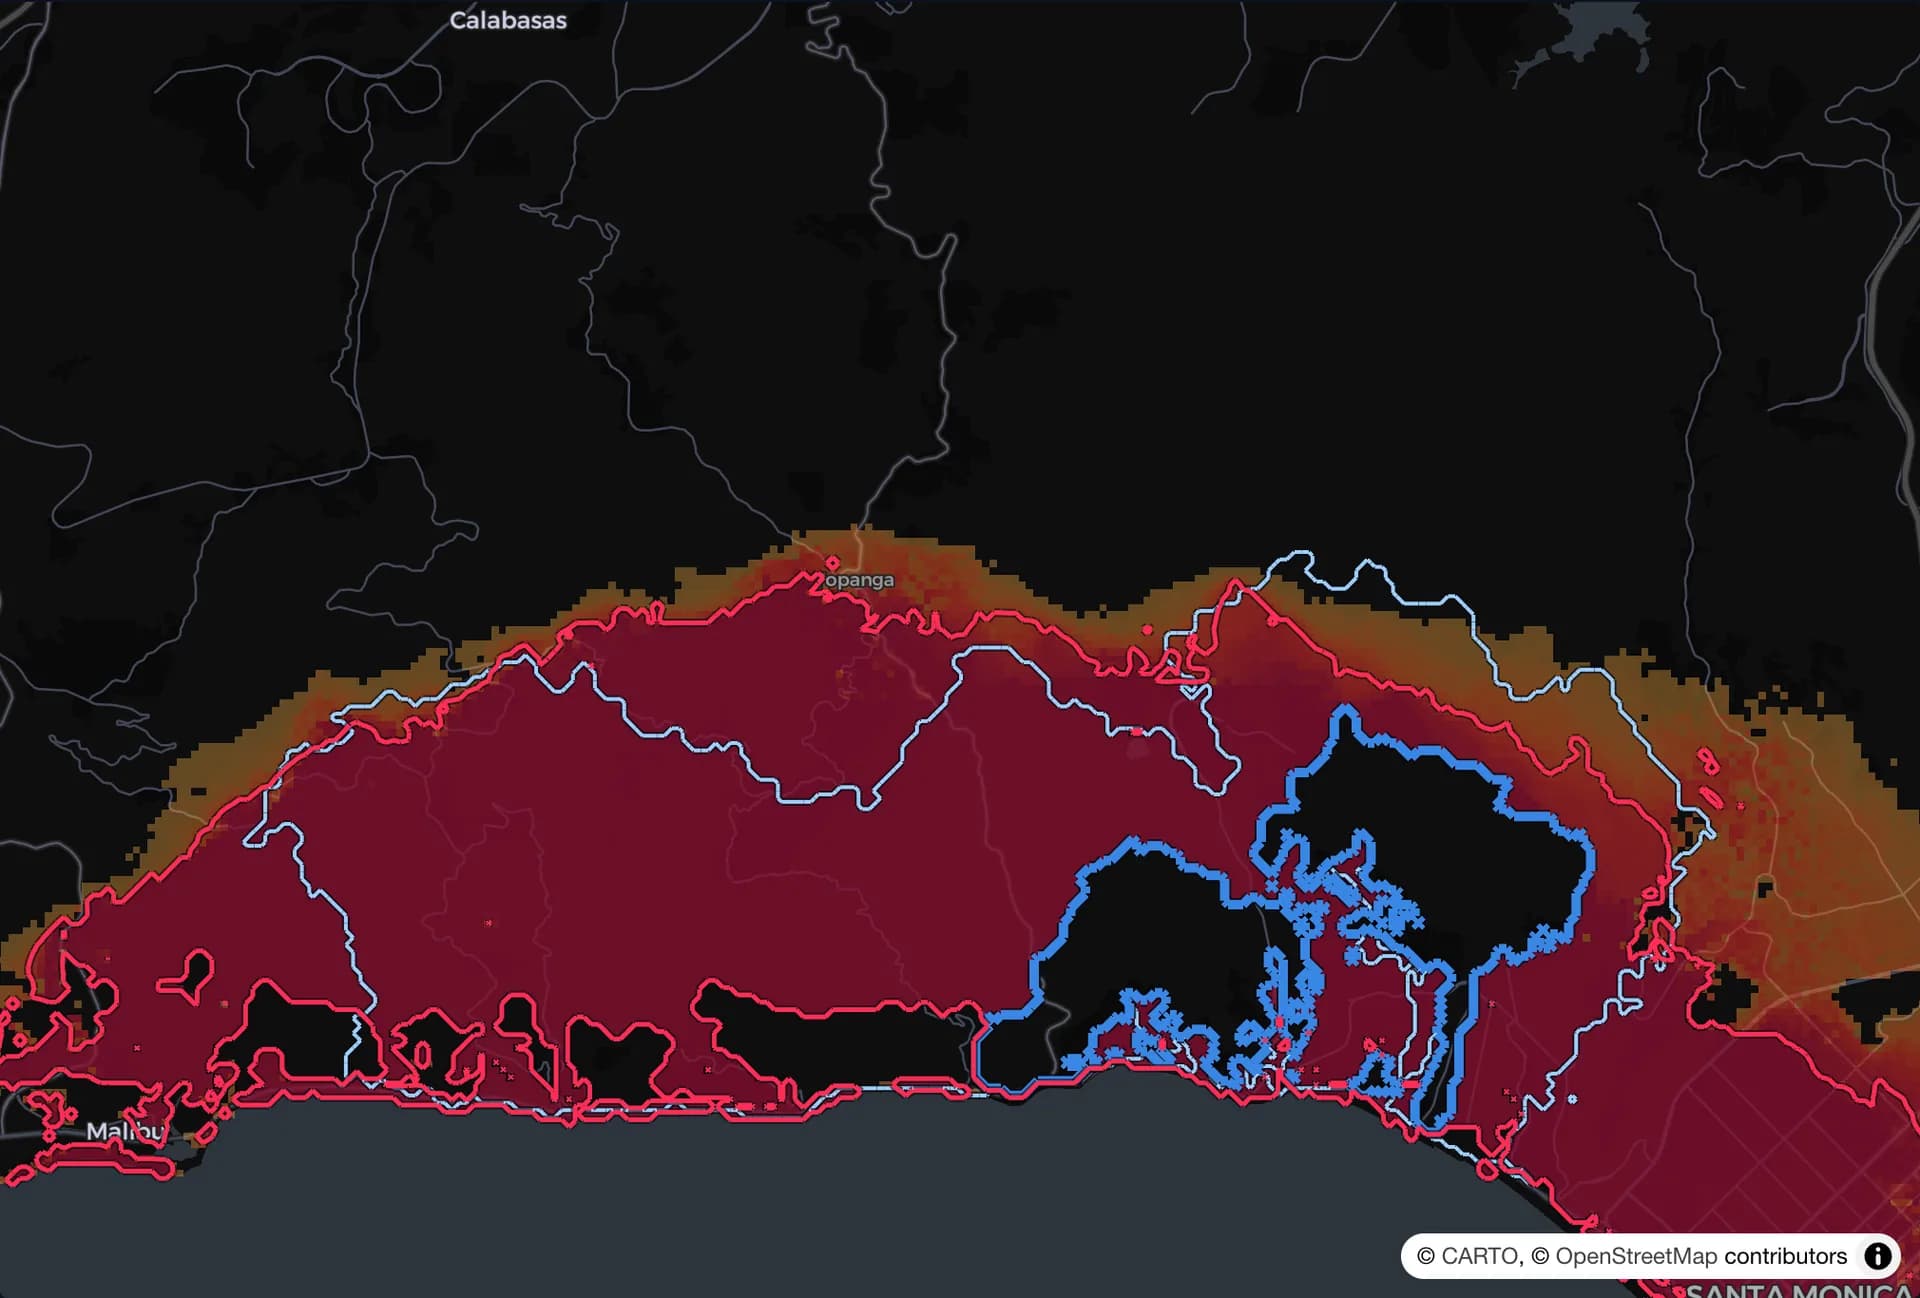
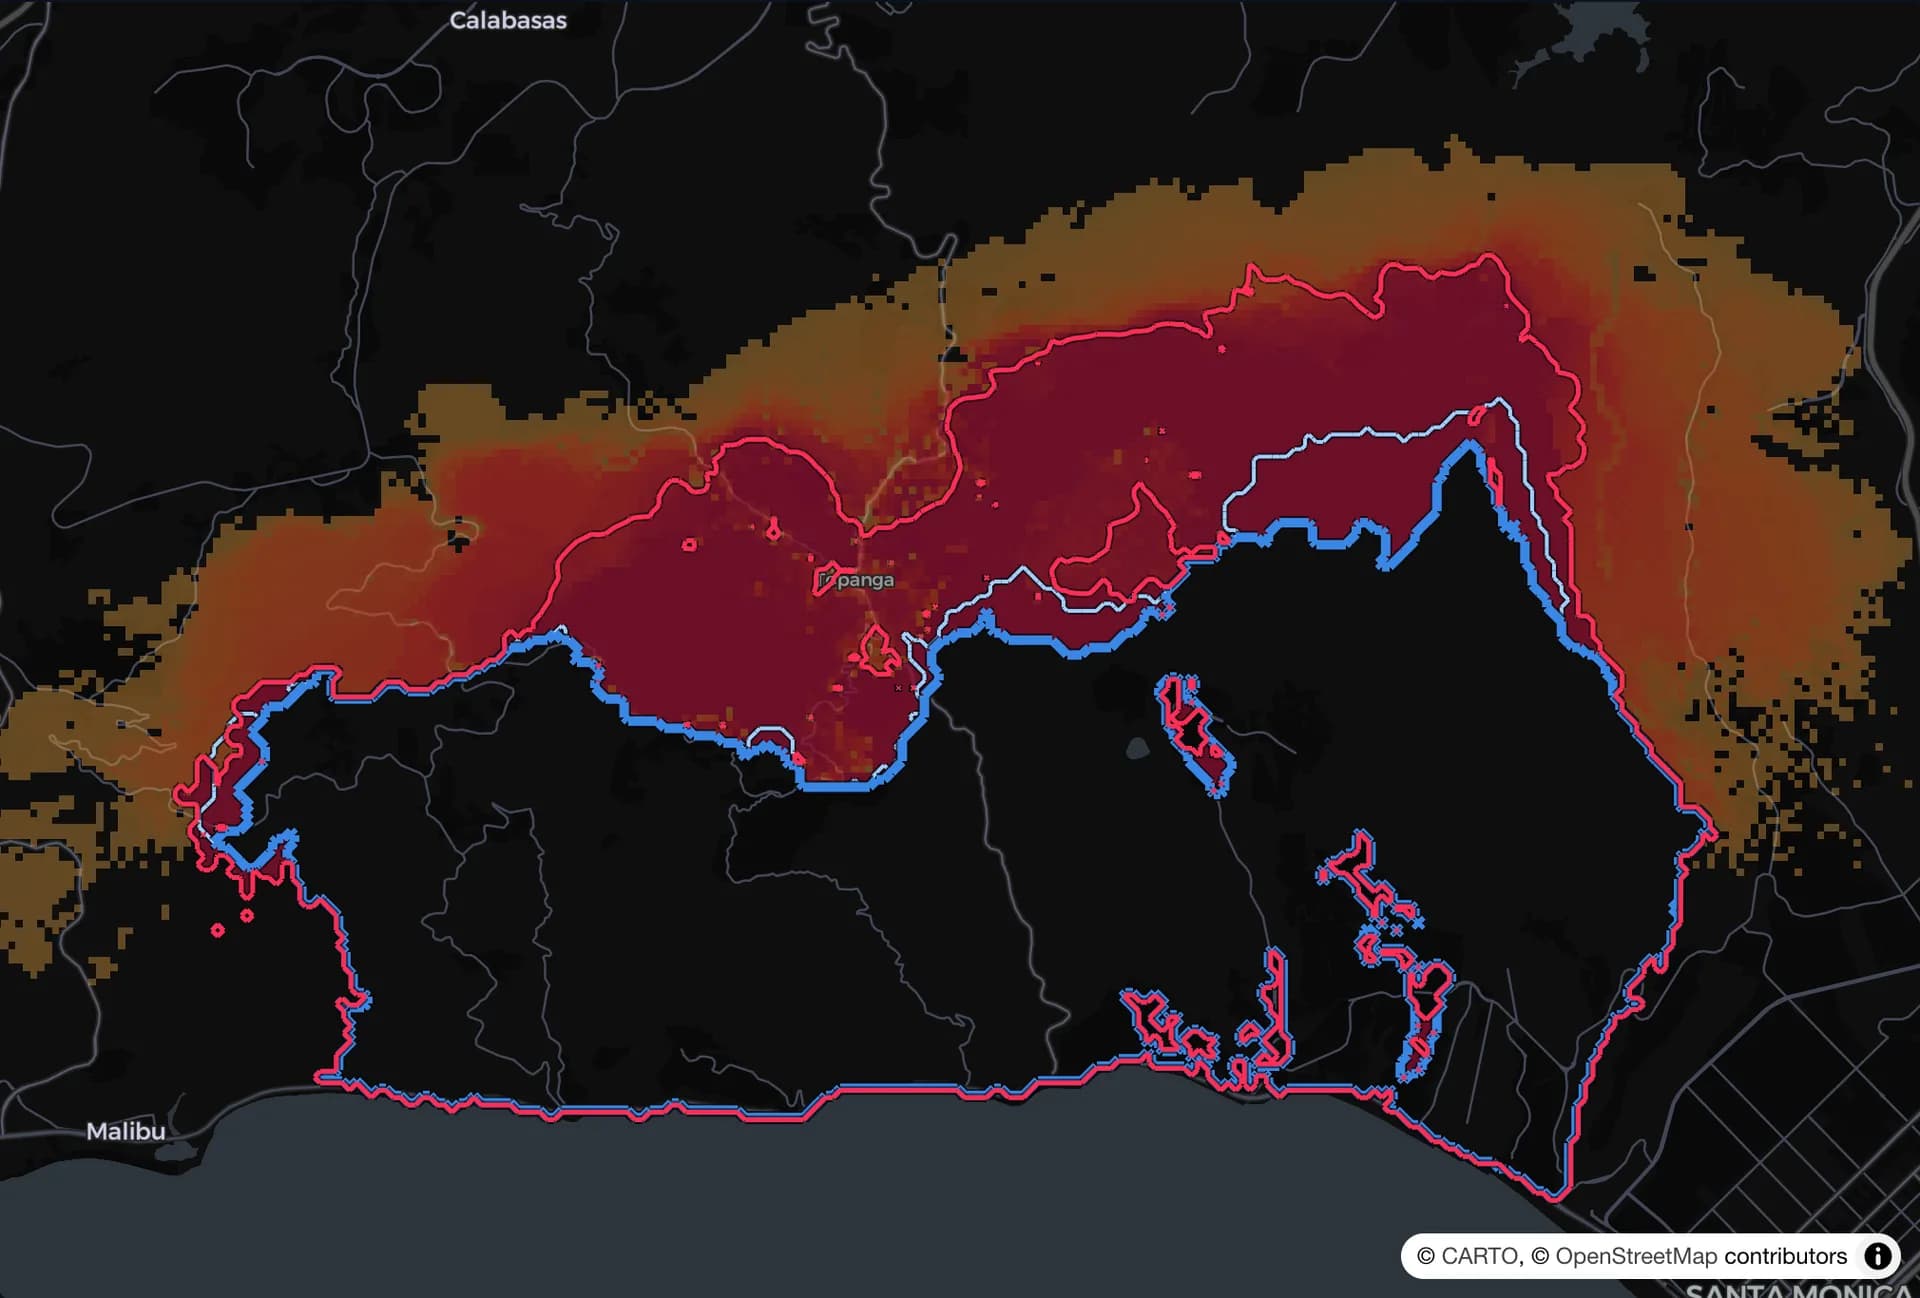
FireShield PWHA runs about a hundred simulated fires side by side, each under slightly different winds and conditions, re-runs them every ten minutes, and aggregates the results into one hazard map: the probability that each spot burns within the next few hours. The red line marks where that probability crosses a set level, drawn ahead of the fire, not behind it.
The method
Built on methods engineers already trust
PWHA follows the same probabilistic hazard approach used to design buildings and bridges for earthquakes, applied to wildfire. Every step is a documented model that can be checked.
Fire-behavior physics
Spread rates from the standard U.S. Forest Service surface-fire model and fuel types, adjusted for slope and wind.
Ensemble of scenarios
About a hundred simulated fires at a time, each with different wind, fuel and ember assumptions, weighted by how well they match the real fire.
Aggregate hazard
The ensemble is combined into burn probabilities and arrival times for every spot, the way seismic hazard maps are built.
Checked against observations
Satellite heat and mapped fire lines update the weights every minute, and every replay is scored against what really burned.
Tested on a real fire
The forecast against what really happened
We replayed the January 2025 Palisades Fire minute by minute, giving the system only what was known at each moment. Red is the fire line FireShield PWHA forecast. Blue is where the fire really was.
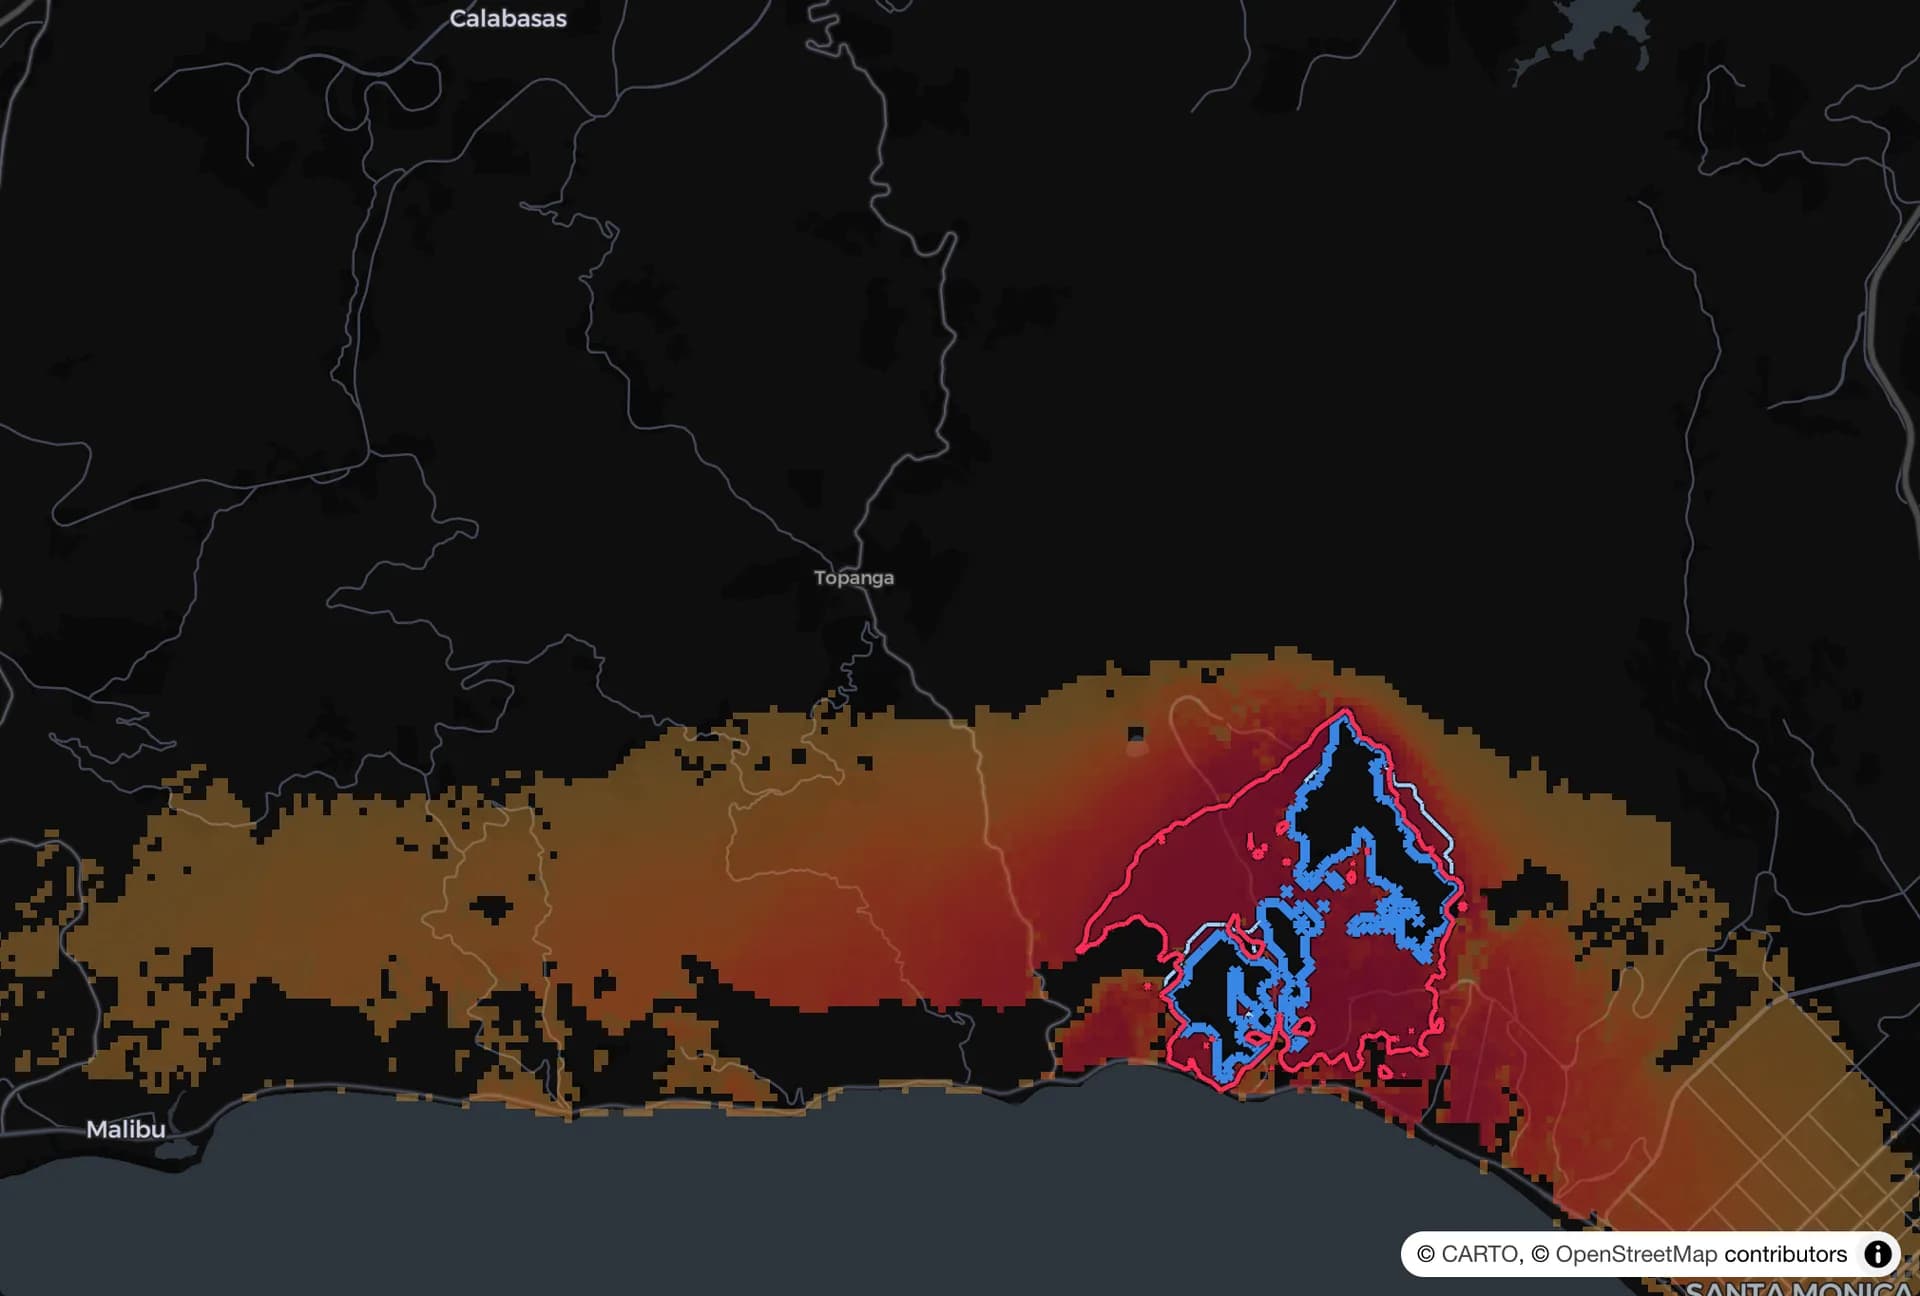
The first hours
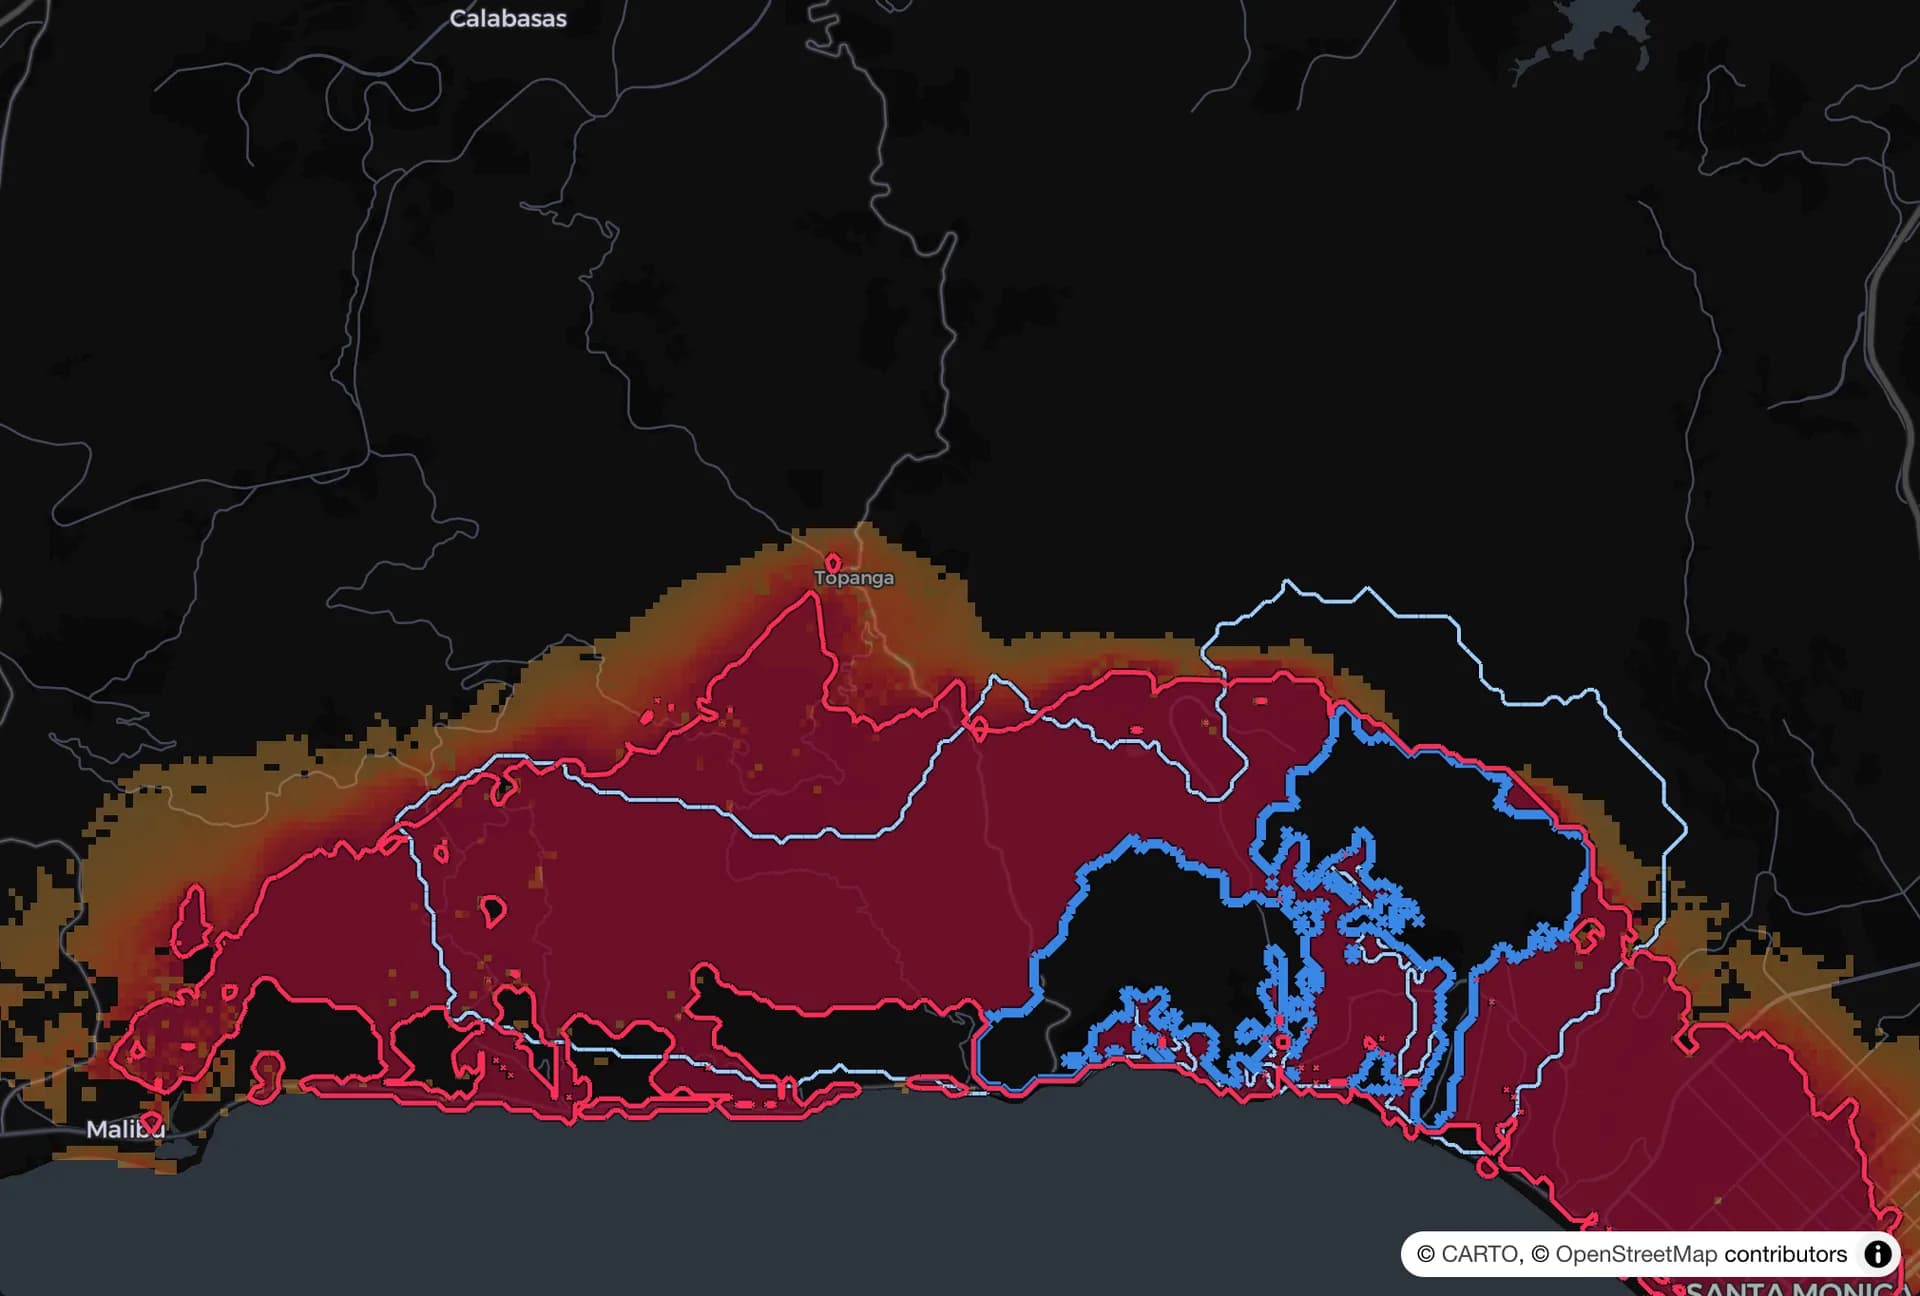
Overnight
The next morning
Day three
Where this research is heading
Toward hours of warning, not minutes
Earlier warning
The goal: know which way a fire is heading before it gets close.
Tested on real fires
We replay past fires with only what was known at the time, and compare.
Always current
The forecast is redone every minute as wind, fire and satellite readings change.
FireShield PWHA is FireShield research, protected by our patent. It is not a public warning or evacuation service, and no forecast can promise what a fire will do. Do not rely on it: always listen to your local fire authorities and follow official evacuation orders.